
Performance Tracking for Division Leaders
The goal of this project was to design a page that enables division leaders to monitor their sales reps' performance. This helps leaders make informed decisions about which team members may need to be deactivated and who is eligible for promotion.
*Please note that this project is still in development at the time of writing.
TEAM
TEAM
3 Designers, 1 Lead Engineer, 4 Developers
3 Designers, 1 Lead Engineer, 4 Developers
MY ROLE
MY ROLE
Product Manager
UX Researcher
UX/UI Designer
Product Manager
UX Researcher
UX/UI Designer
TIMELINE
TIMELINE
August 2024 - December 2024
August 2024 - December 2024
BACKGROUND
BACKGROUND
As a Product Designer at Spartan Solar, I had the opportunity to design and develop an internal platform tailored for our sales and administrative teams.
Our [door-to-door] sales team is organized into divisions, with each sales representative reporting to one or more division leaders. These divisions are incentivized to compete against each other, making it crucial for division leaders to closely monitor their reps' performances. They rely on key metrics such as the number of sales and installations completed per month to track progress and ensure their teams are meeting goals effectively.
PROBLEM
PROBLEM
The previous division page had several usability challenges, including:
• Lack of mobile responsiveness
• Poor scannability
• No options to change sorting or apply filters
• No confirmation prompts or feedback after key actions like promoting, deactivating, or editing rep details (e.g., no “Are you sure?” message or success confirmation)
HOW MIGHT WE…
HOW MIGHT WE…
build a division page that's intuitive, accessible, and clear, making it easy for users to manage reps from any device?
build a division page that's intuitive, accessible, and clear, making it easy for users to manage reps from any device?
THE SOLUTION
THE SOLUTION
Build a cleaner, mobile-friendly division page that helps leaders track team performance and manage reps more quickly, clearly, and reliably across all devices.
Build a cleaner, mobile-friendly division page that helps leaders track team performance and manage reps more quickly, clearly, and reliably across all devices.
The Approach
The Approach
The Approach
Testing out the old design
Testing out the old design
Before making any changes to the old design, I wanted to understand how it functioned by exploring the page and its interactions firsthand.
Before making any changes to the old design, I wanted to understand how it functioned by exploring the page and its interactions firsthand.
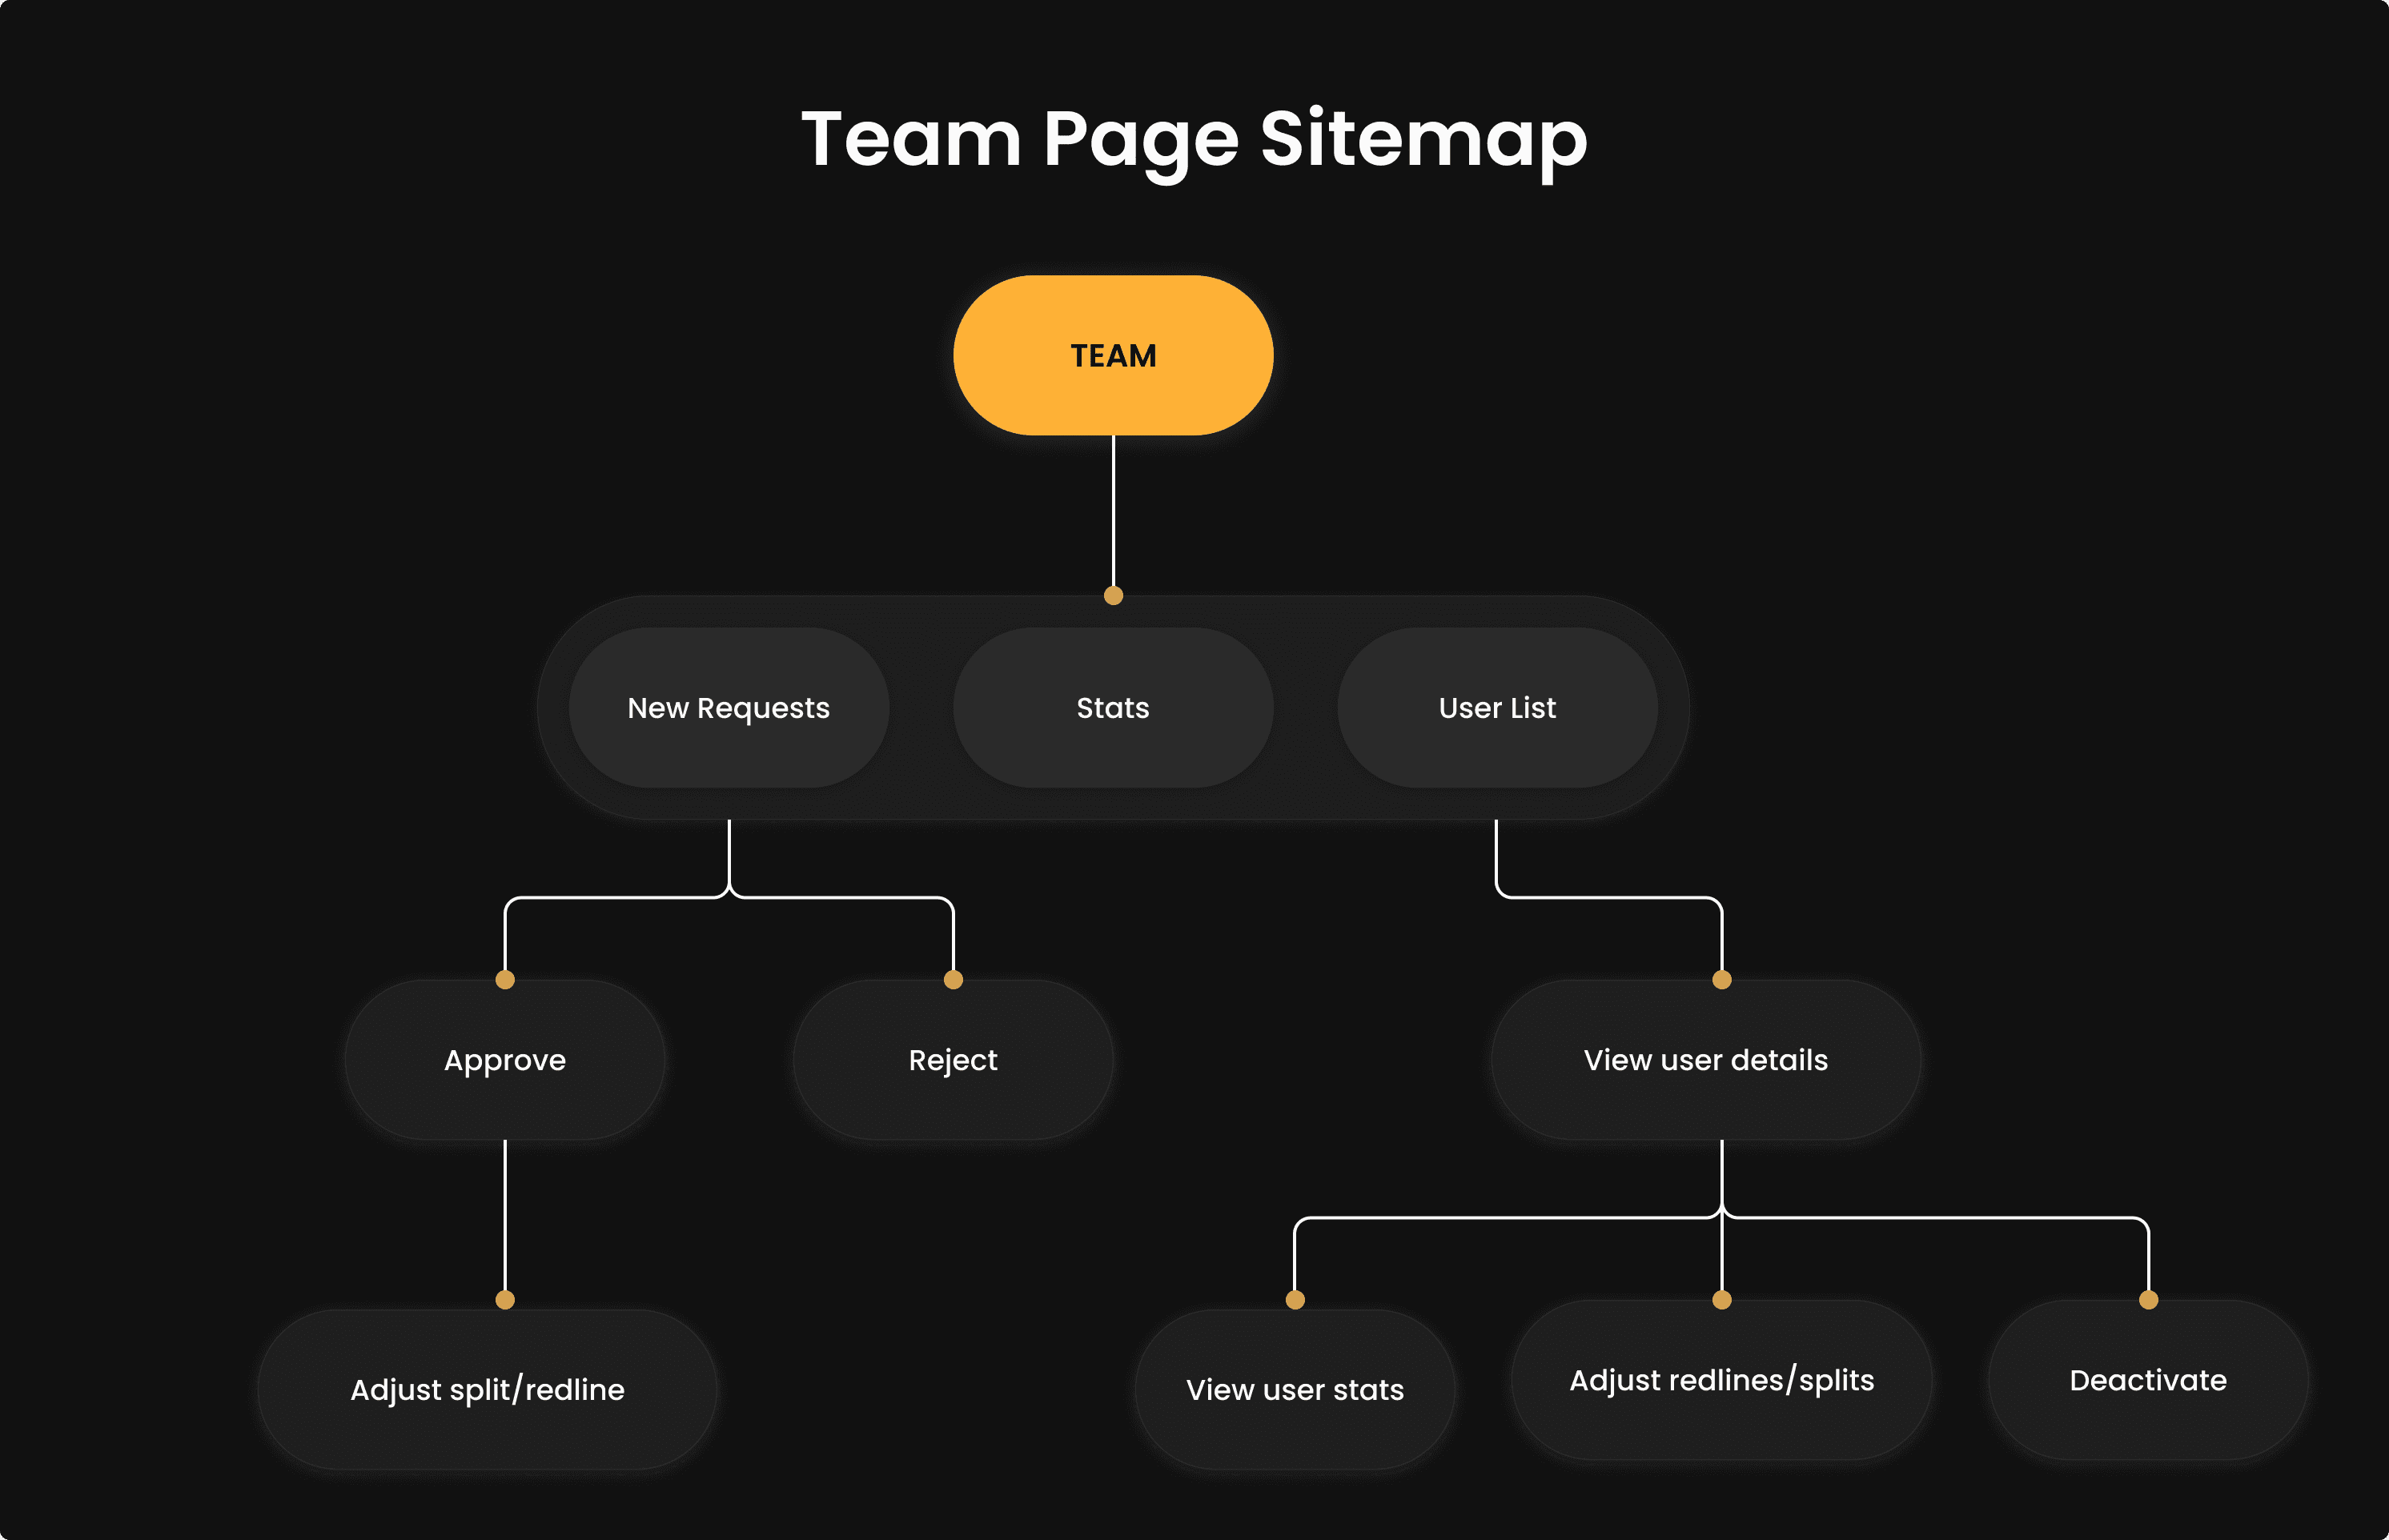
I created a sitemap to help me understand the way users navigate this page.
I created a sitemap to help me understand the way users navigate this page.
After reviewing the page, I conducted usability testing with division leaders to gain insight into their workflow. I asked questions such as:
• What do you use this page for?
• How often do you use it?
• What device do you typically use to access this page?
• What metrics are most important for you to track?
• What challenges do you face when navigating this page?
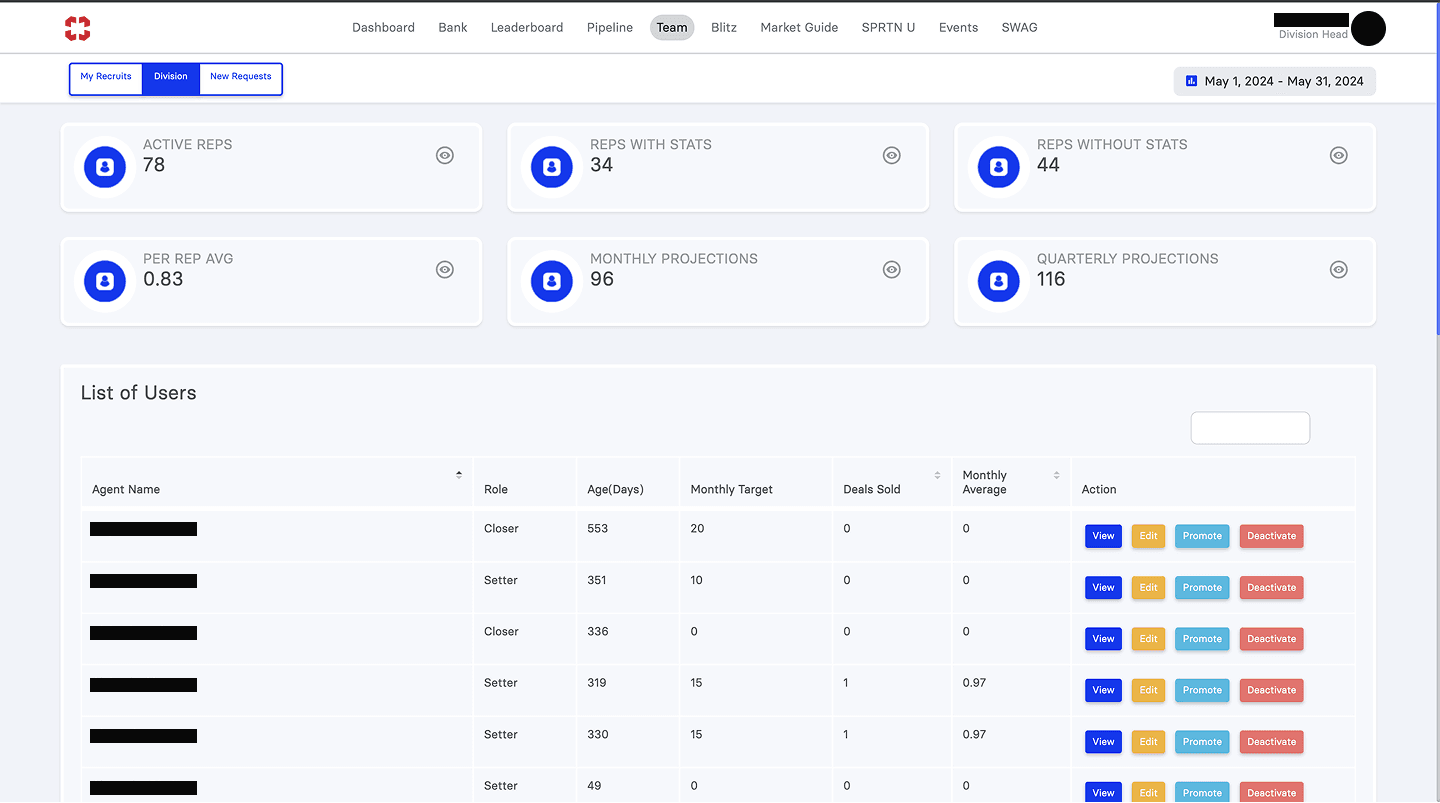
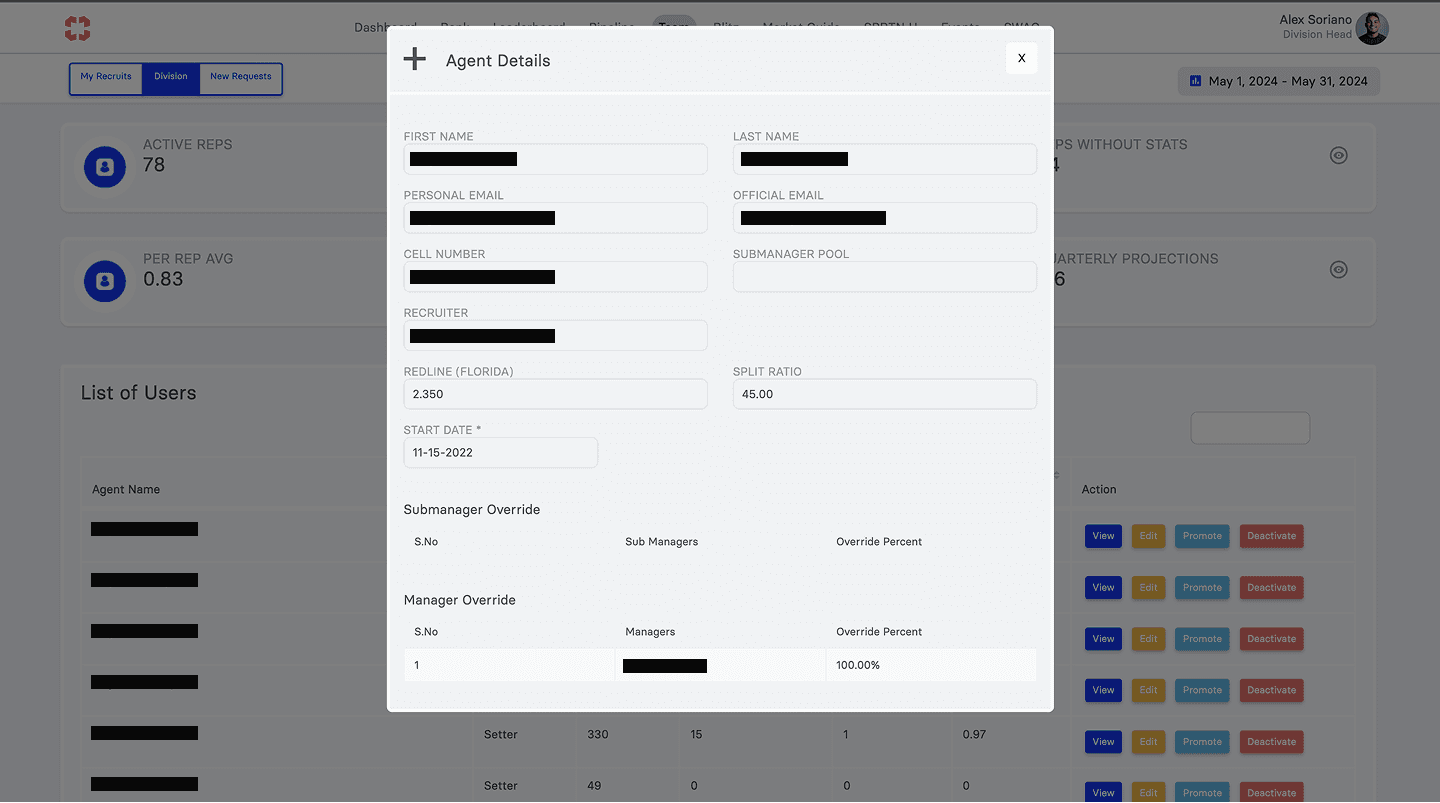
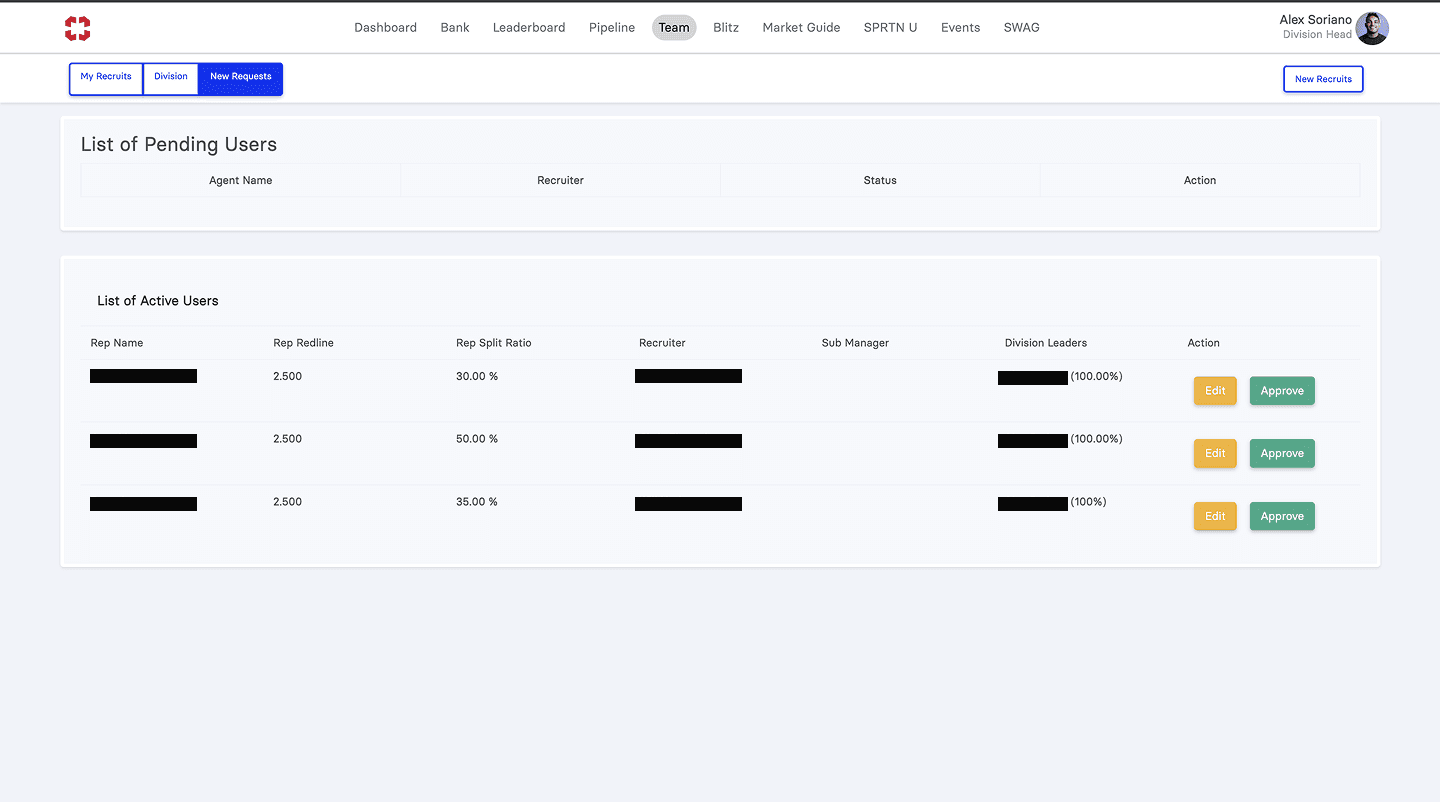
The images shown above are screenshots of the old Division Page.
The images shown above are screenshots of the old Division Page.
I discovered that division leaders primarily used this page to:
✅ Add new recruits
✅ Approve new requests
✅ Onboard reps
✅ Track rep stats (e.g., see who met their monthly goal)
✅ Promote or deactivate reps
Usage frequency varied, with leaders accessing the page anywhere from once a week to once a month.
Division leaders stated that:
• The interface felt cluttered and difficult to navigate
• The entire page was not mobile-friendly, causing content to be cut off
• The monthly average metric was not useful
• "My Recruits" data was inaccurate
• The "New Recruits" button was hard to find
• Sorting options were needed for: setters and closers, deals sold
One key concern was that since they are often on the go and don’t have time to sit at a computer to approve new reps, they would need to access this on their phones. As of right now, the page's poor responsiveness has made that impossible.
BRAINSTORMING SOLUTIONS
GATHERING USER INSIGHTS
GATHERING USER INSIGHTS
After identifying user pain points, I grouped features into must-haves, nice-to-haves, and future ideas, prioritizing those with high impact and low effort. I then worked closely with developers and stakeholders to finalize priorities.
As we evaluated the team page and its recruitment features, we realized it made more sense to split them into two distinct pages. The division page would focus on helping leaders manage reps and track performance, while the recruitment page would give all reps the ability to bring in new recruits. This separation made both pages more focused and effective.
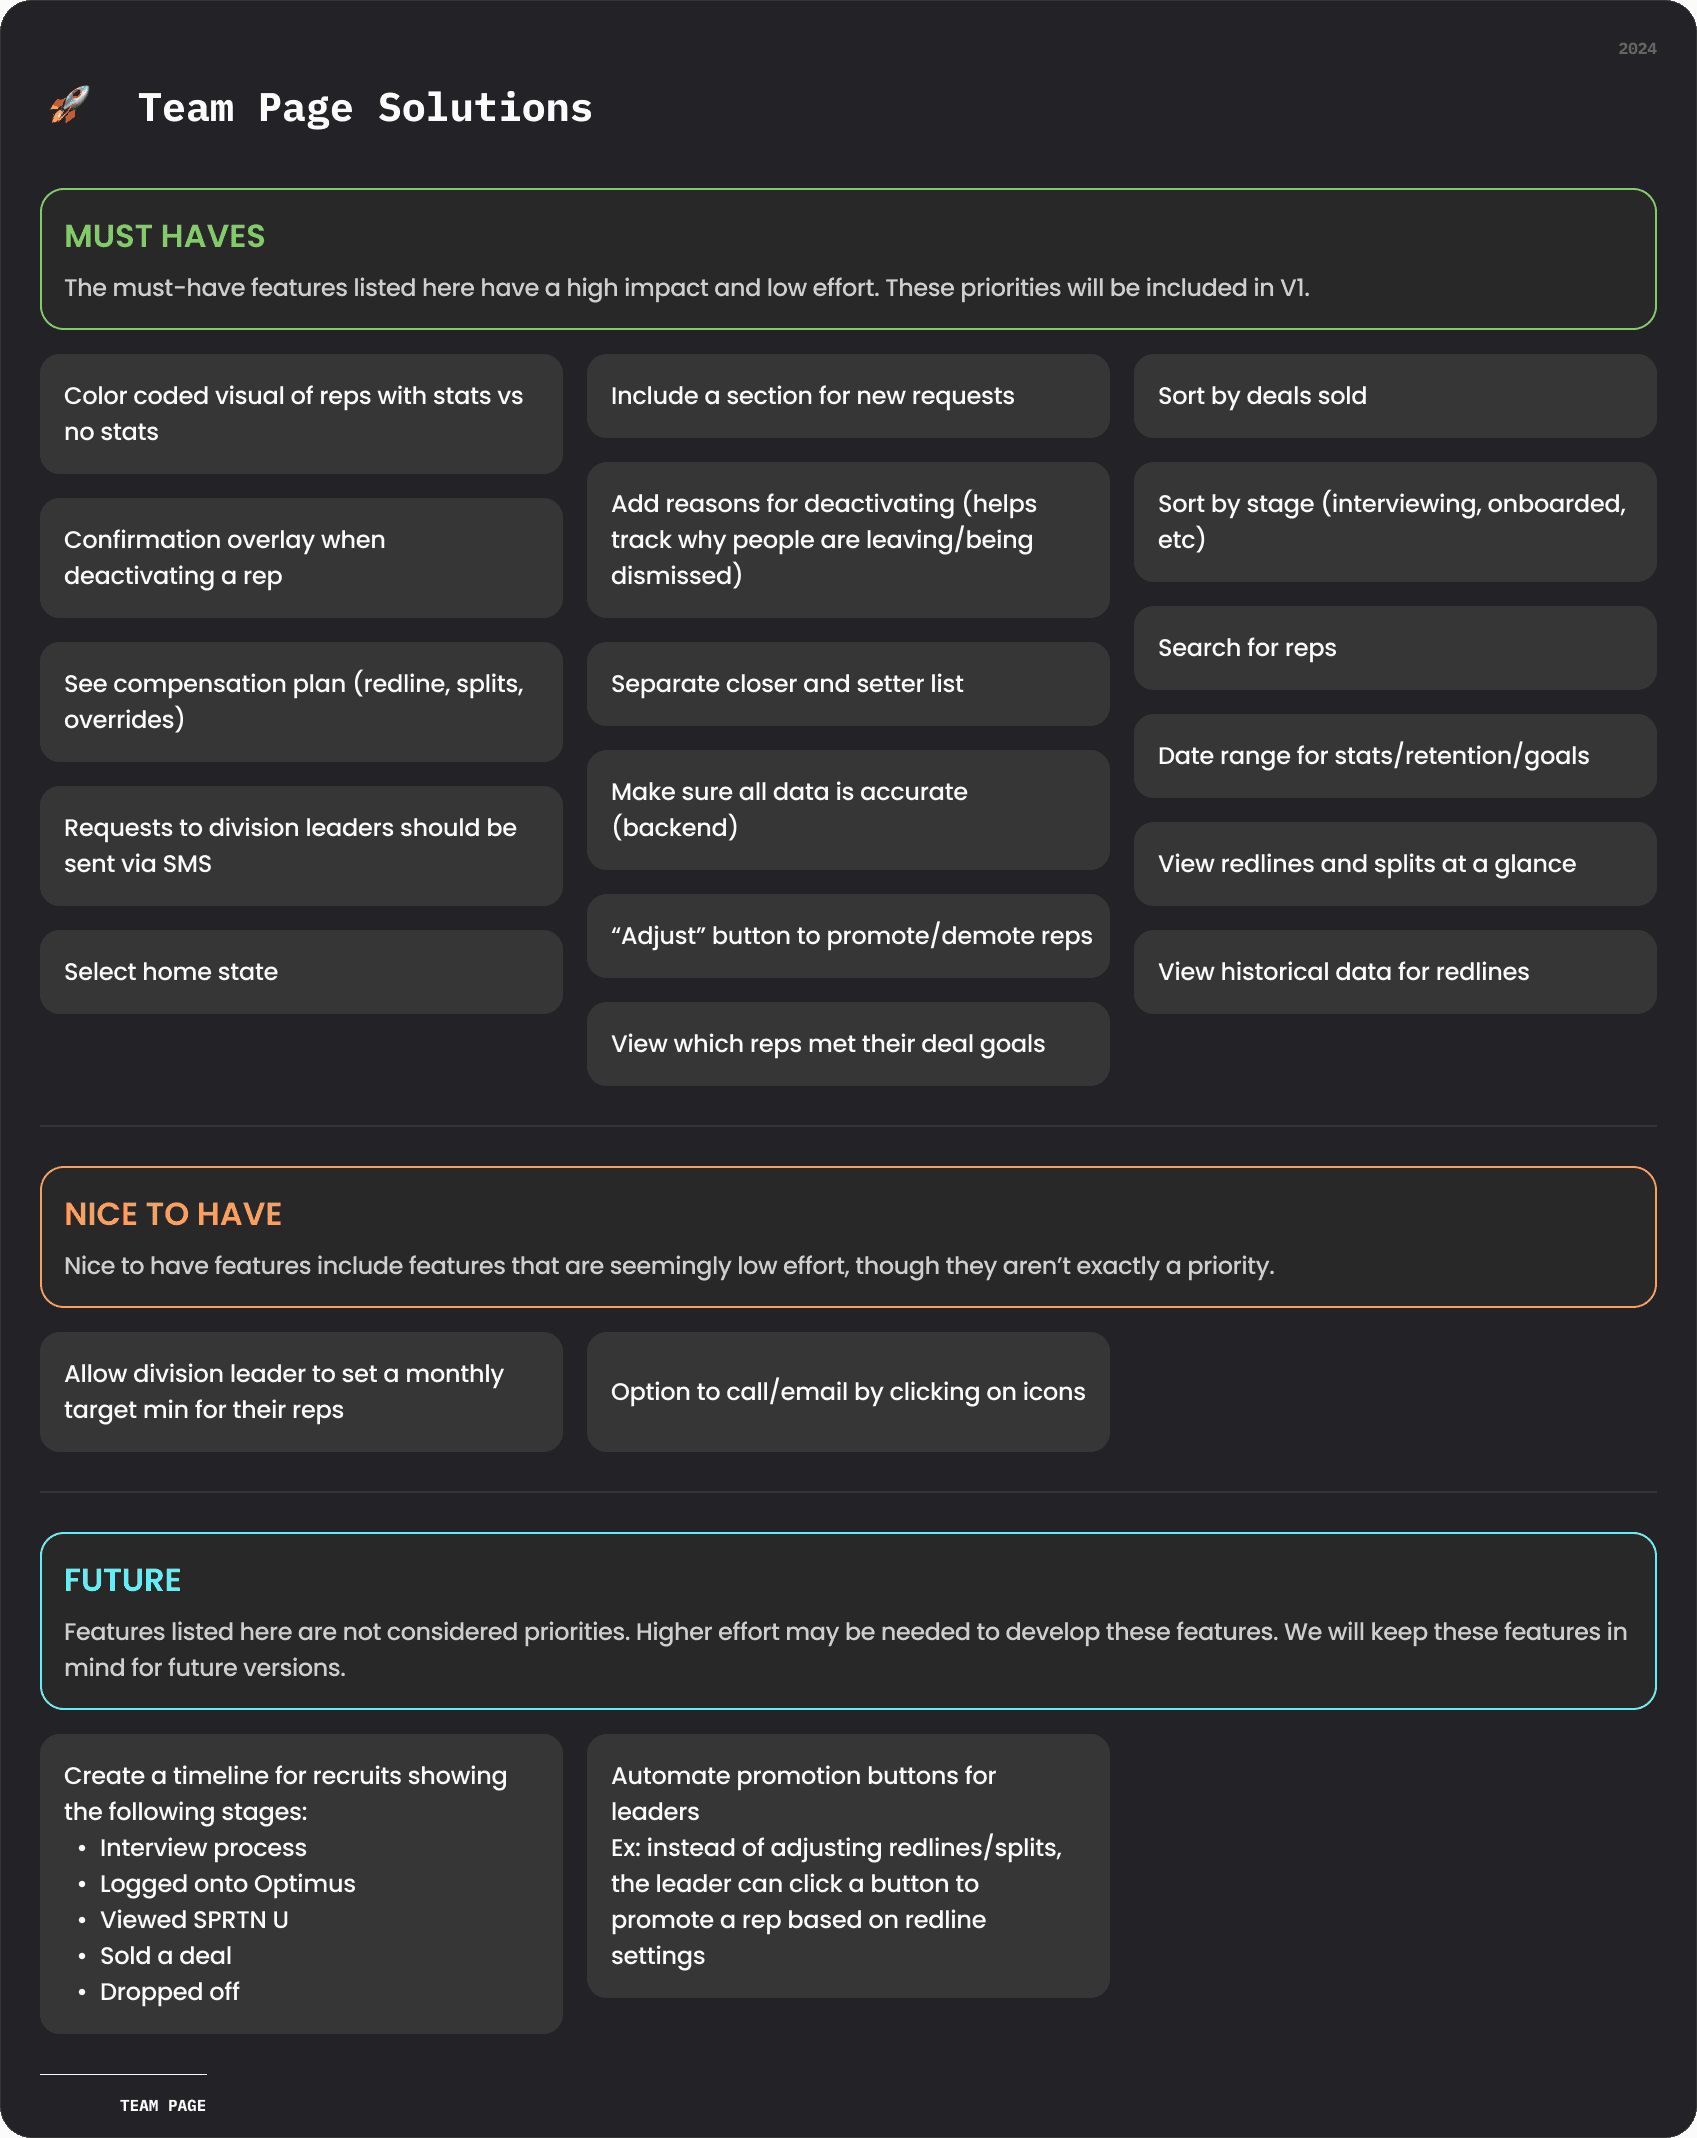
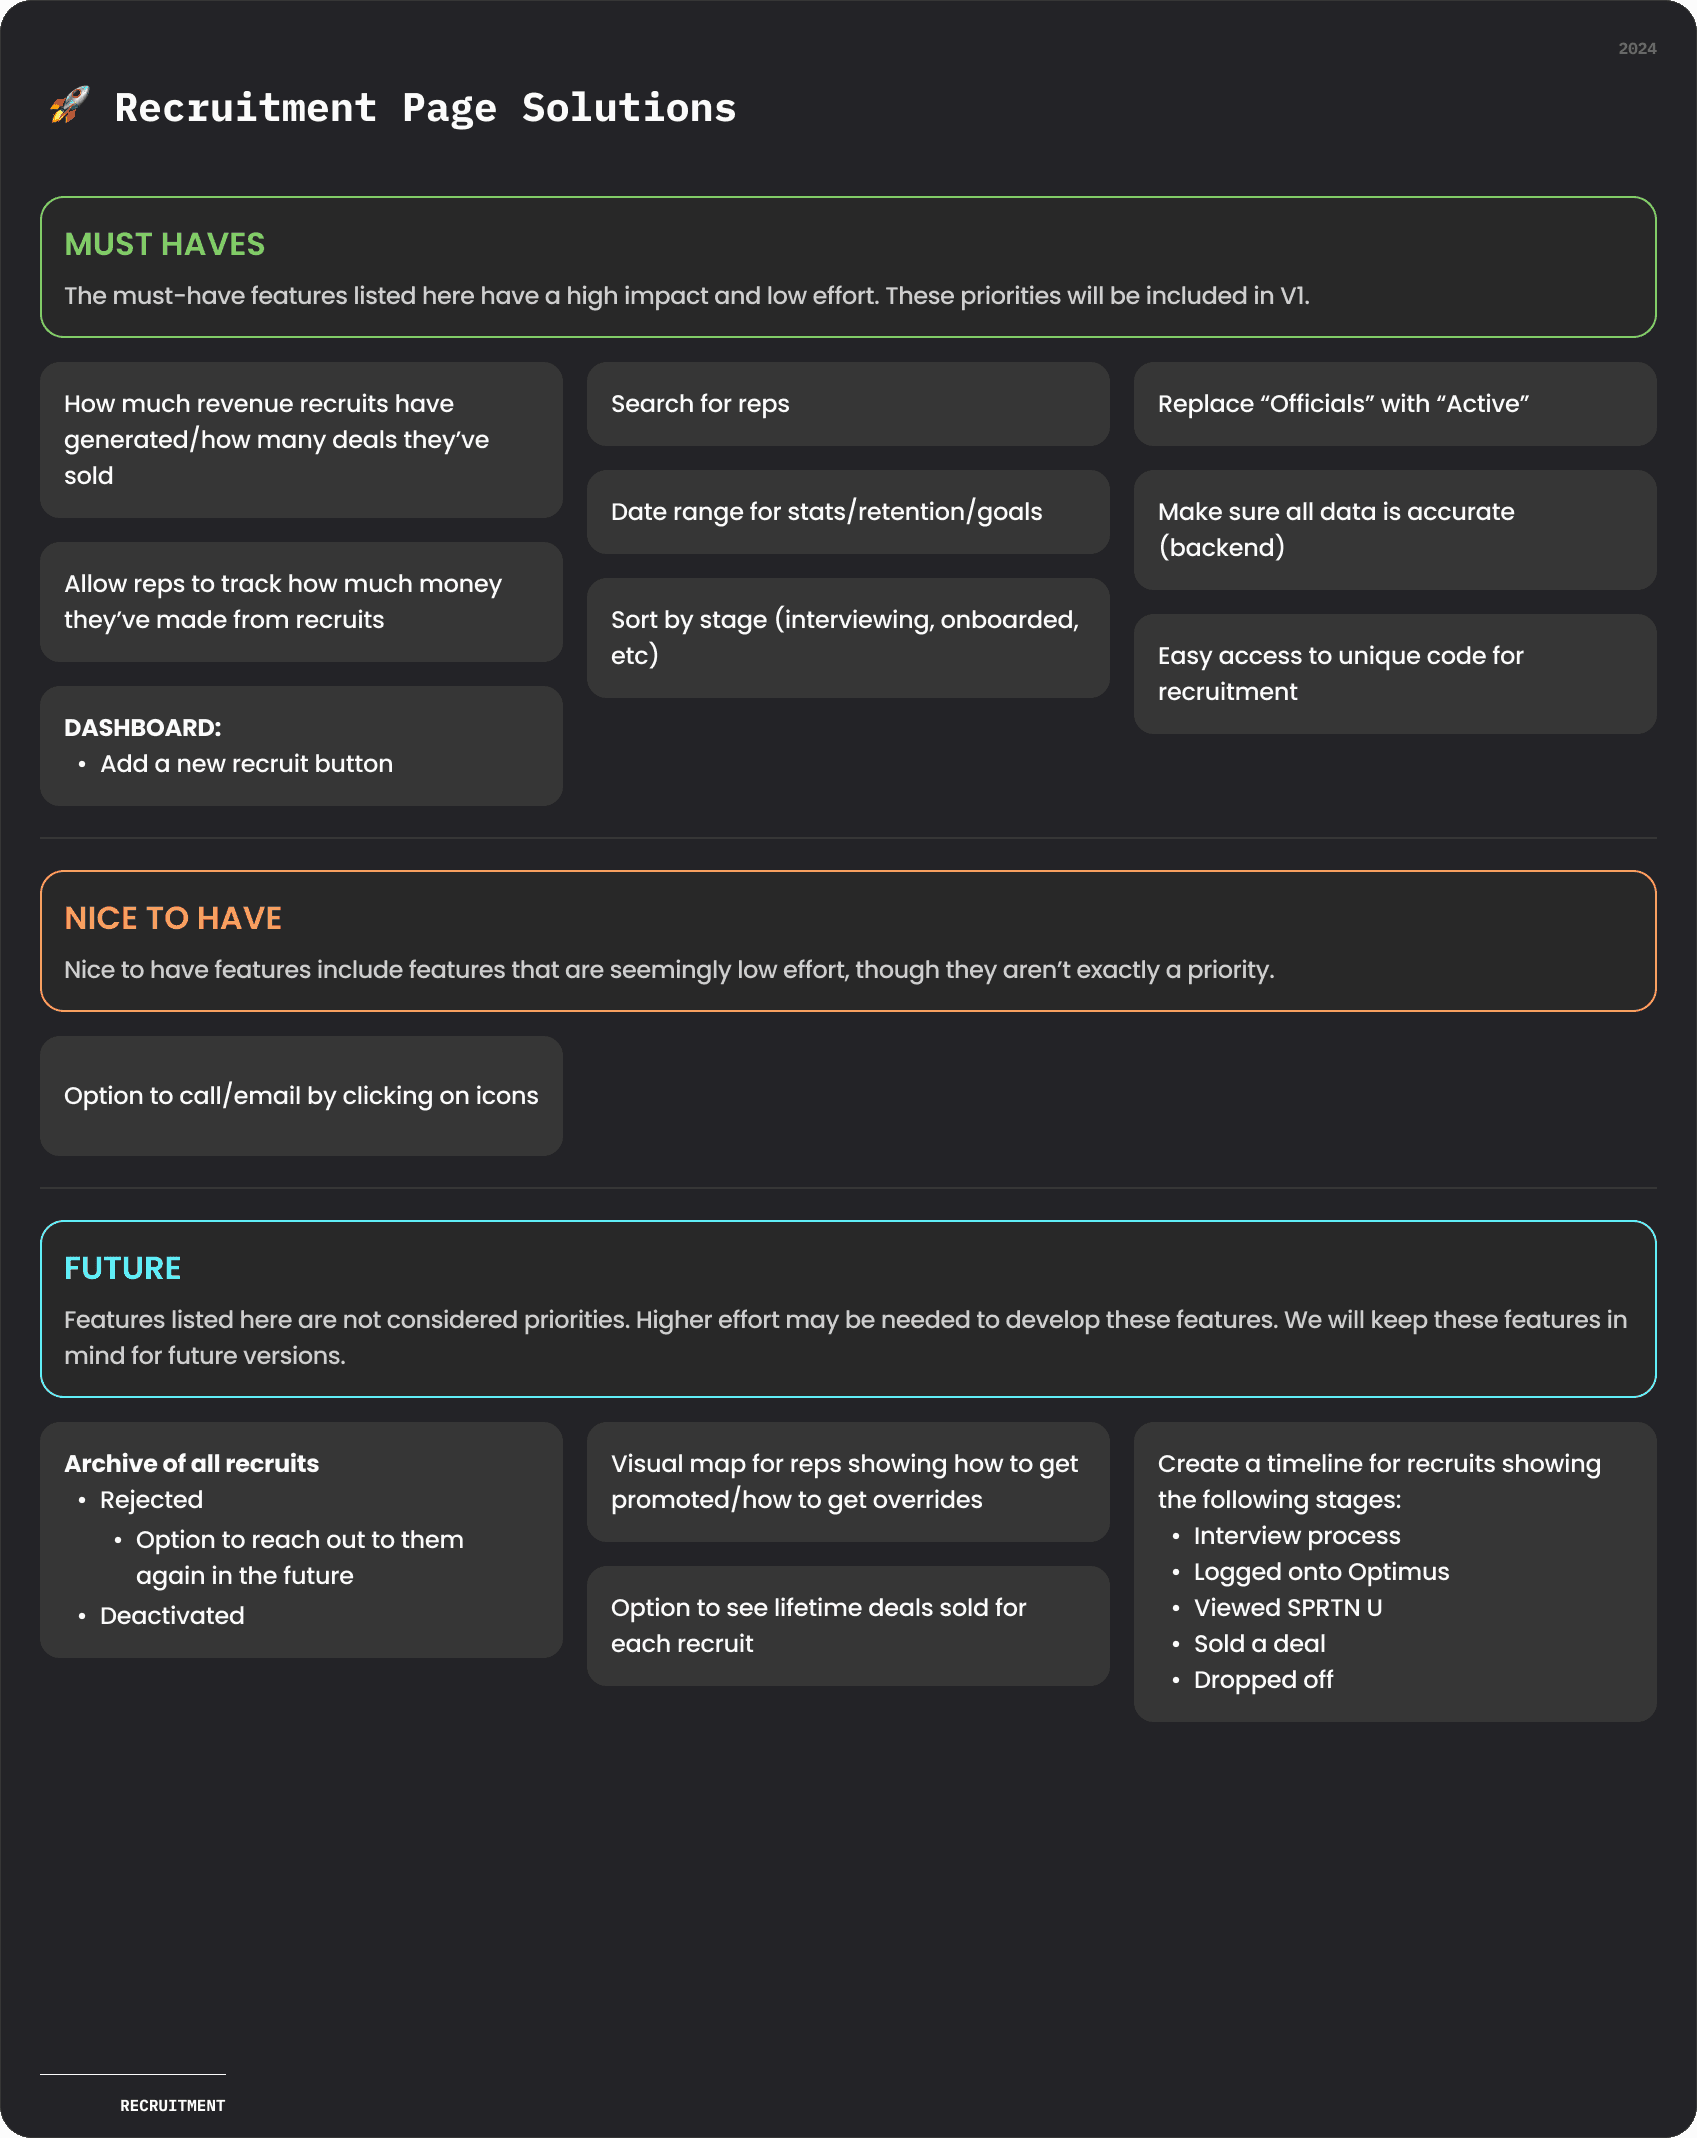
What started as a single project evolved into 2, as we recognized the need to separate distinct functions with its own features.
What started as a single project evolved into 2, as we recognized the need to separate distinct functions with its own features.
Moving on to Designs
Moving on to Designs
Moving on to Designs
INSPO GATHERING
INSPO GATHERING
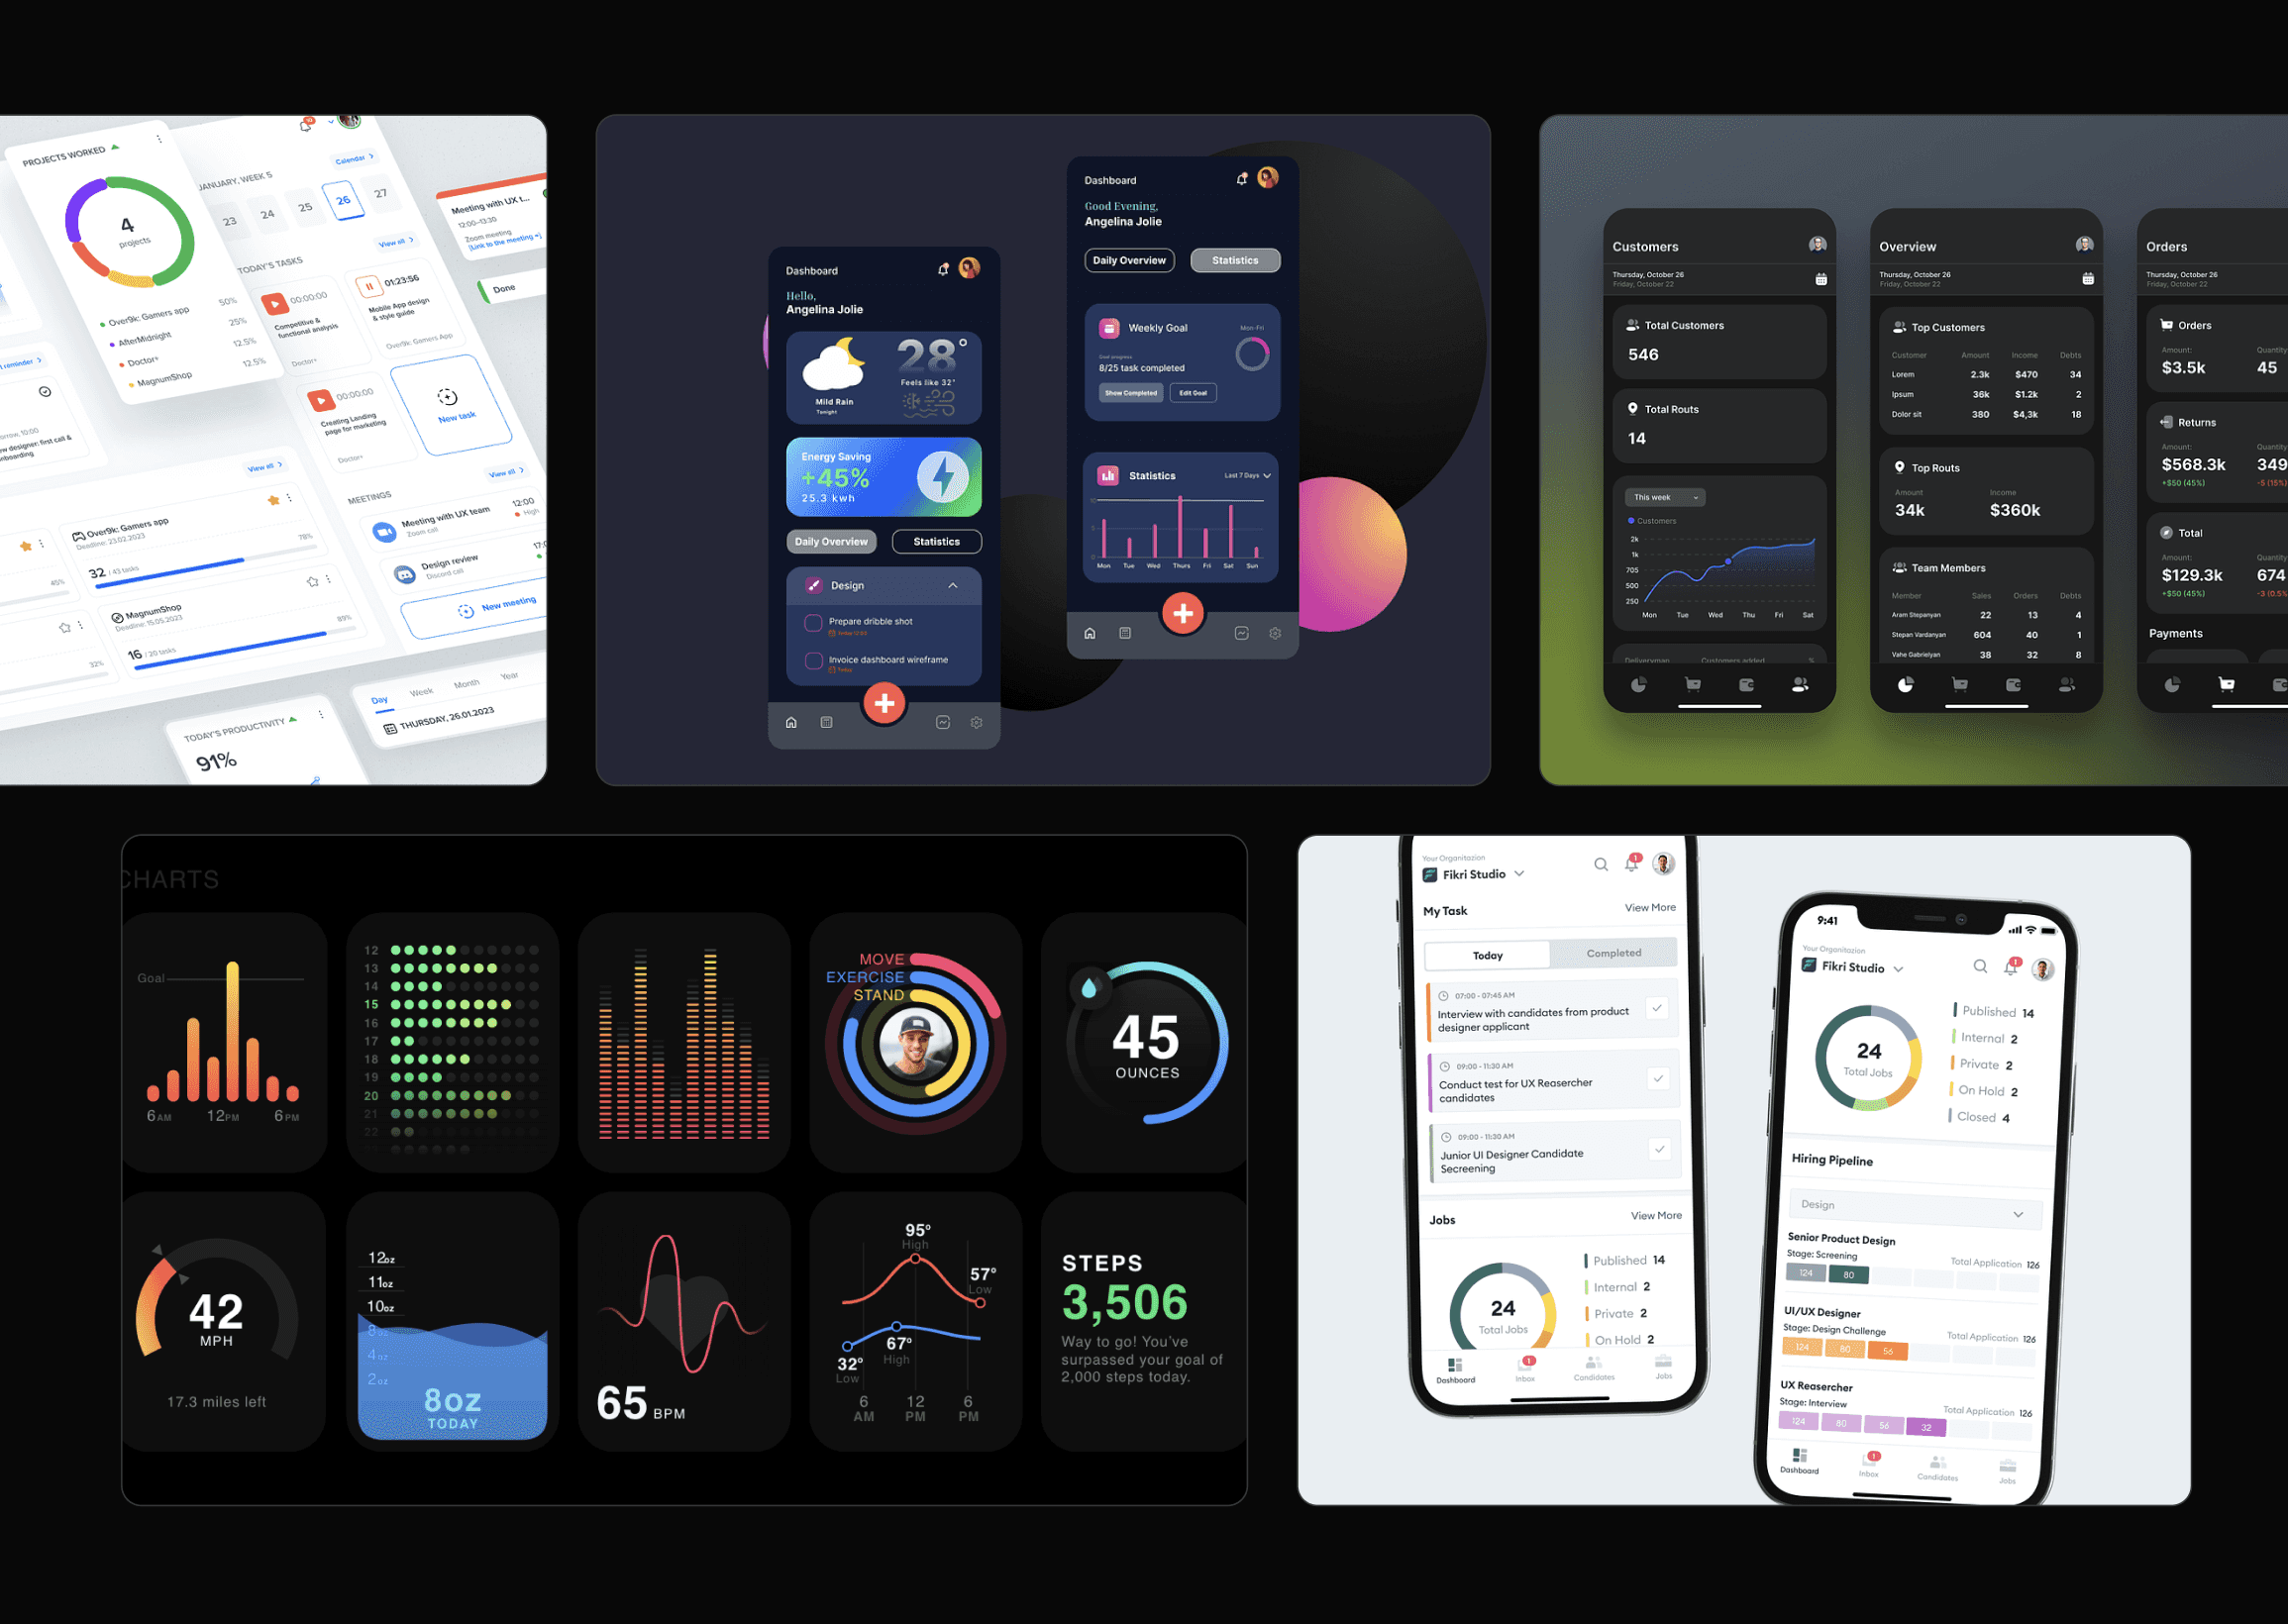
After reviewing the feature list, I explored different platforms for inspiration, identifying components that could enhance my design while prioritizing a mobile-first approach.
I particularly looked for platforms displaying stats in a visually-appealing and user-friendly way, using Apple Health as one of my main pages for inspiration.
Lofi Screens
Lofi Screens
Reimagining Designs for Better Usability
When I started designing the low-fidelity screens, I focused on the key features we agreed on for V1 while making sure we kept the important functionalities from the previous design.
Below is an early version of the low-fidelity screens, one of many iterations before finalizing the design.
When I started designing the low-fidelity screens, I focused on the key features we agreed on for V1 while making sure we kept the important functionalities from the previous design.
Below is an early version of the low-fidelity screens, one of many iterations before finalizing the design.
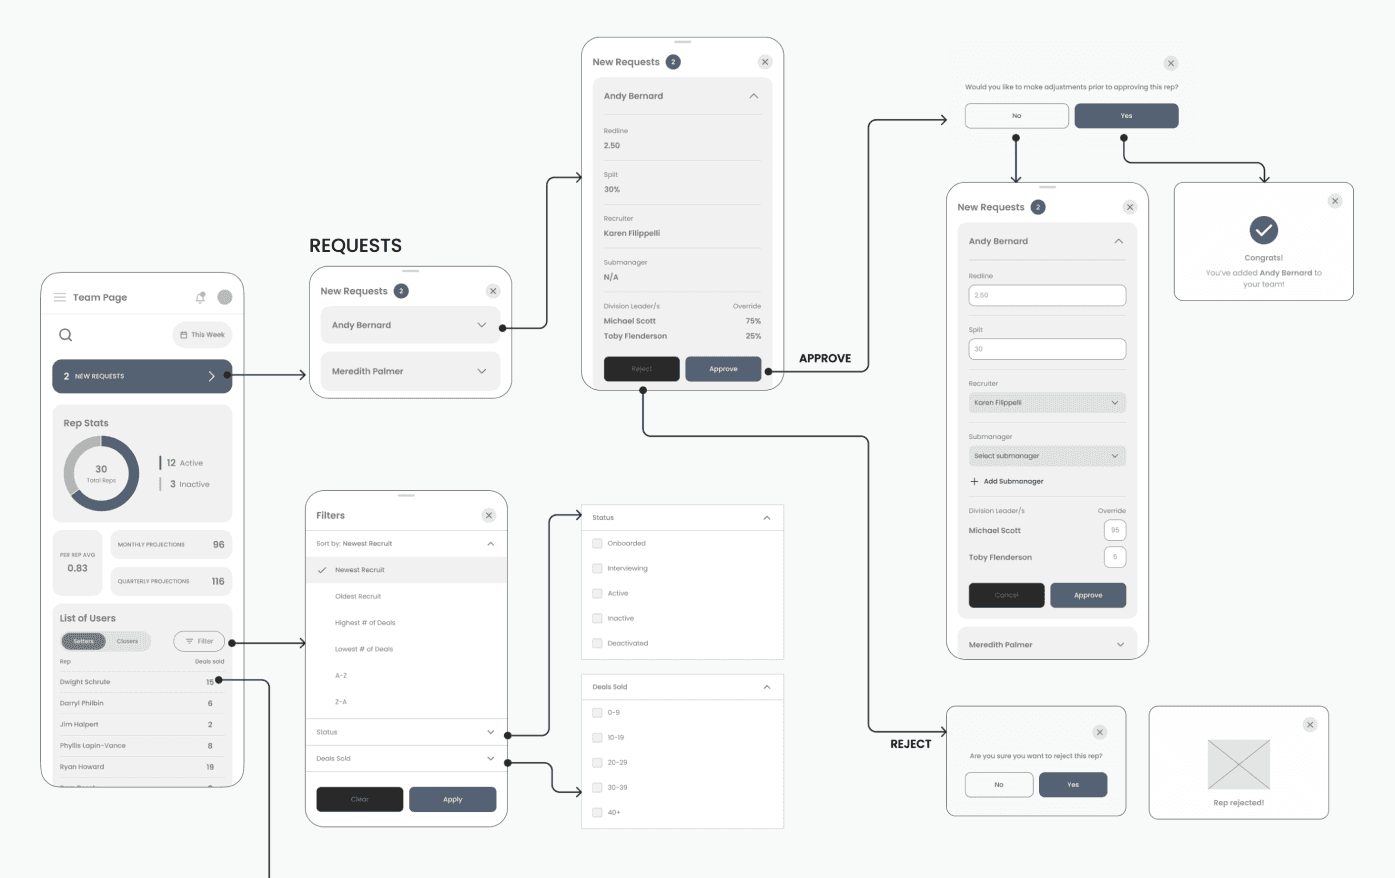
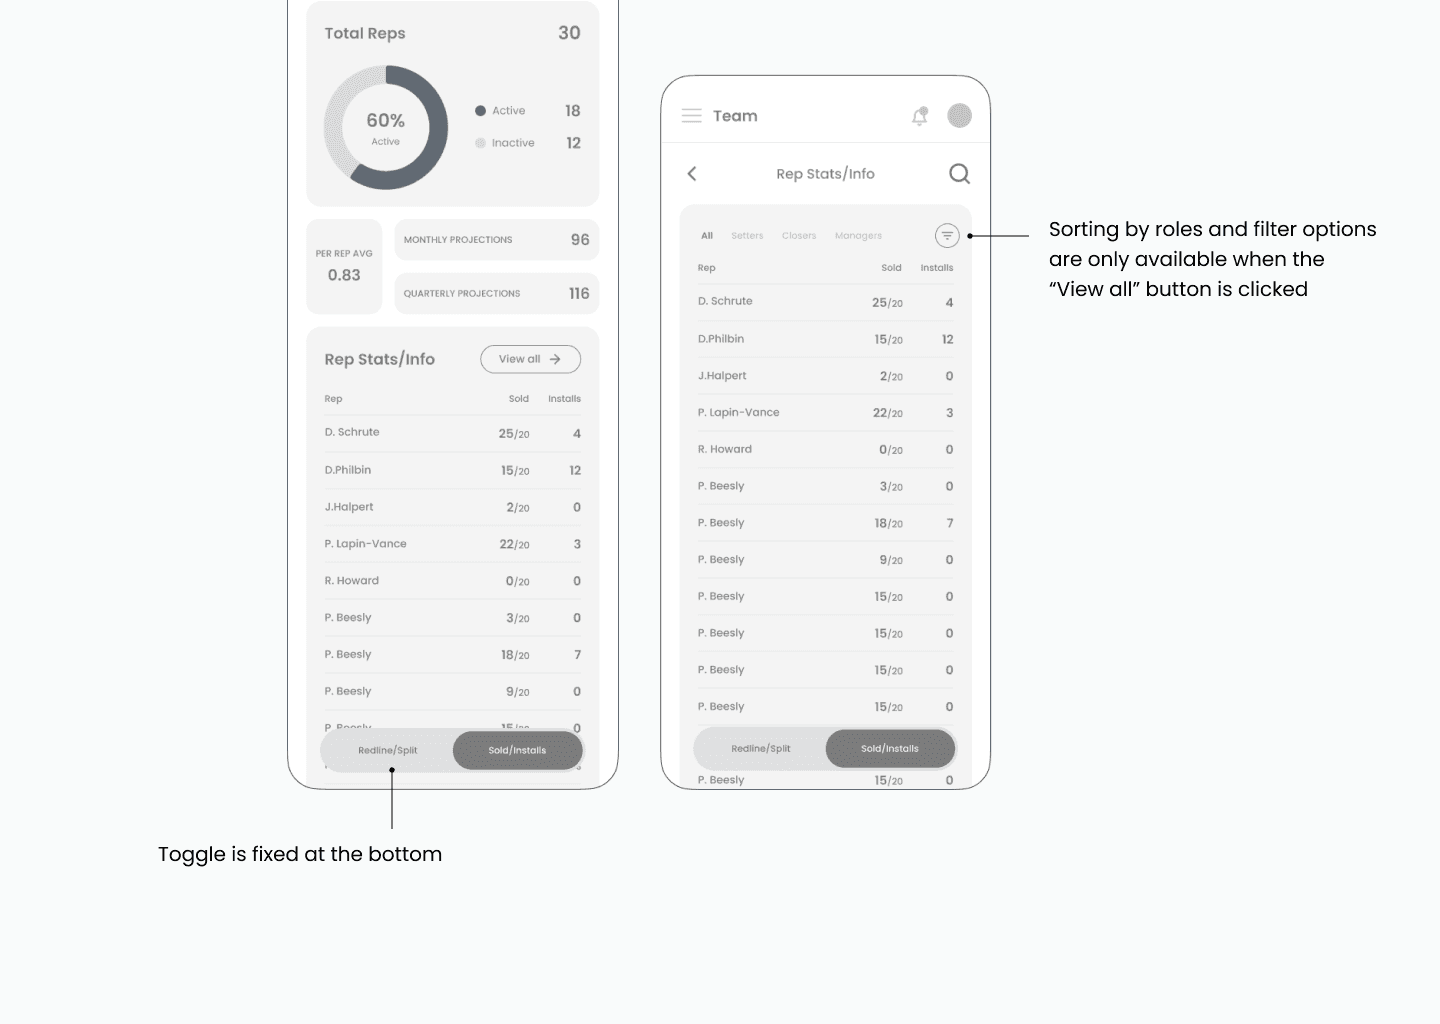
Here are some early drafts highlighting my design decisions (in the image), along with stakeholder feedback (at the bottom), which helped guide my iterations throughout the product lifecycle:
Here are some early drafts highlighting my design decisions (in the image), along with stakeholder feedback (at the bottom), which helped guide my iterations throughout the product lifecycle:
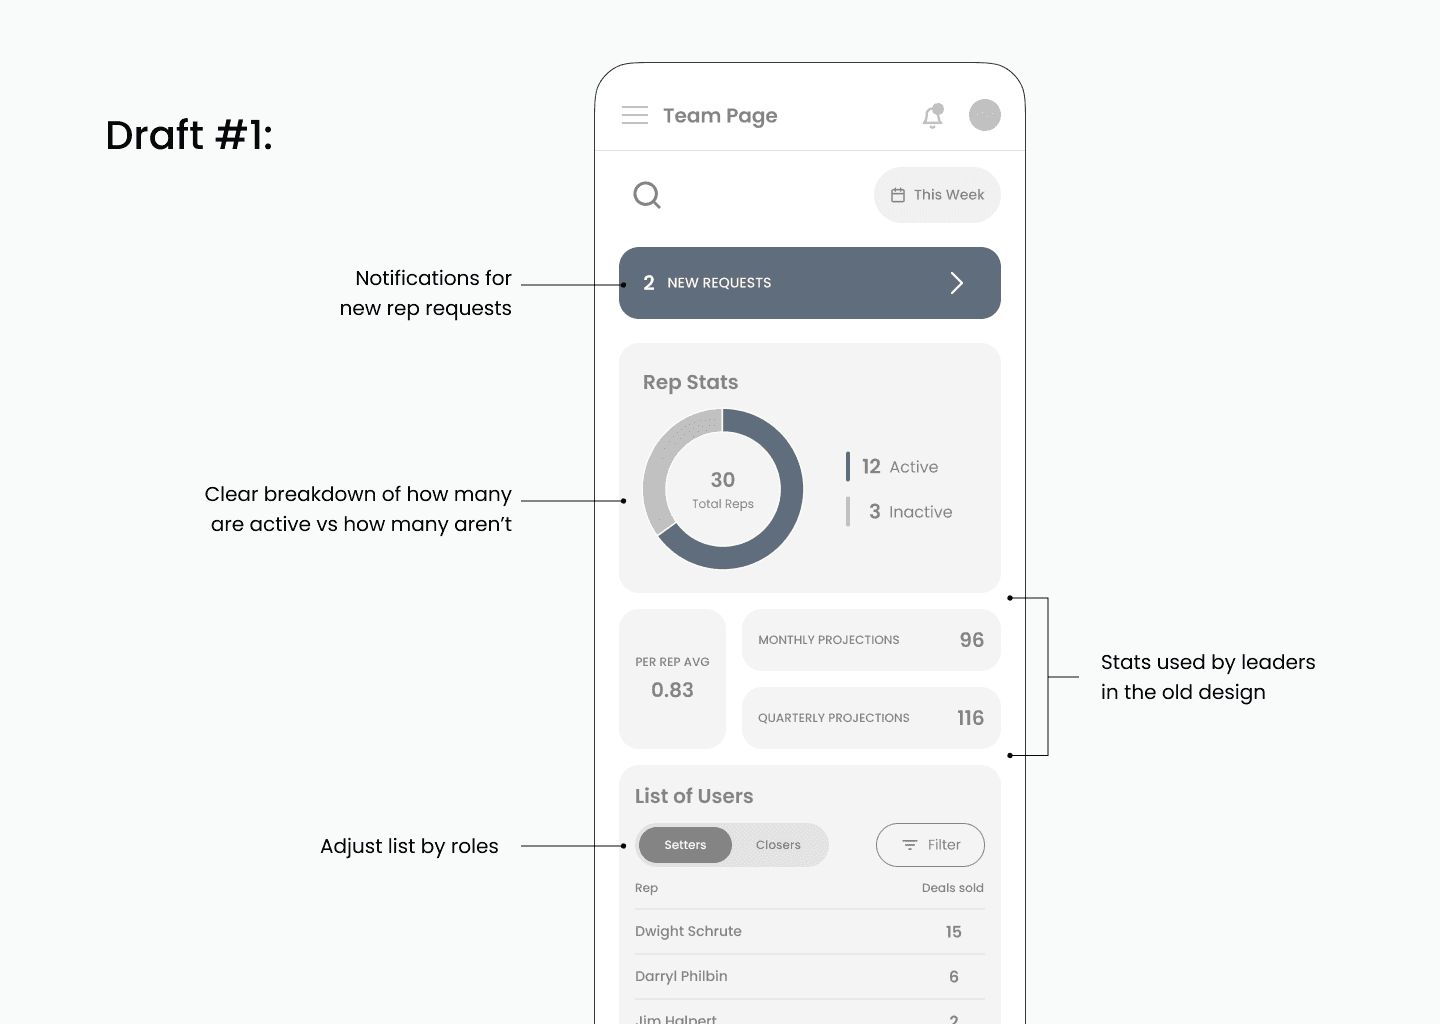
📢 Feedback received from stakeholders:
• Add a percentage indicator for active reps
• Provide at-a-glance views of redlines/splits (how much a rep earns per deal), along with deals sold and goals status
• Adjust list view by setters, closers, AND managers
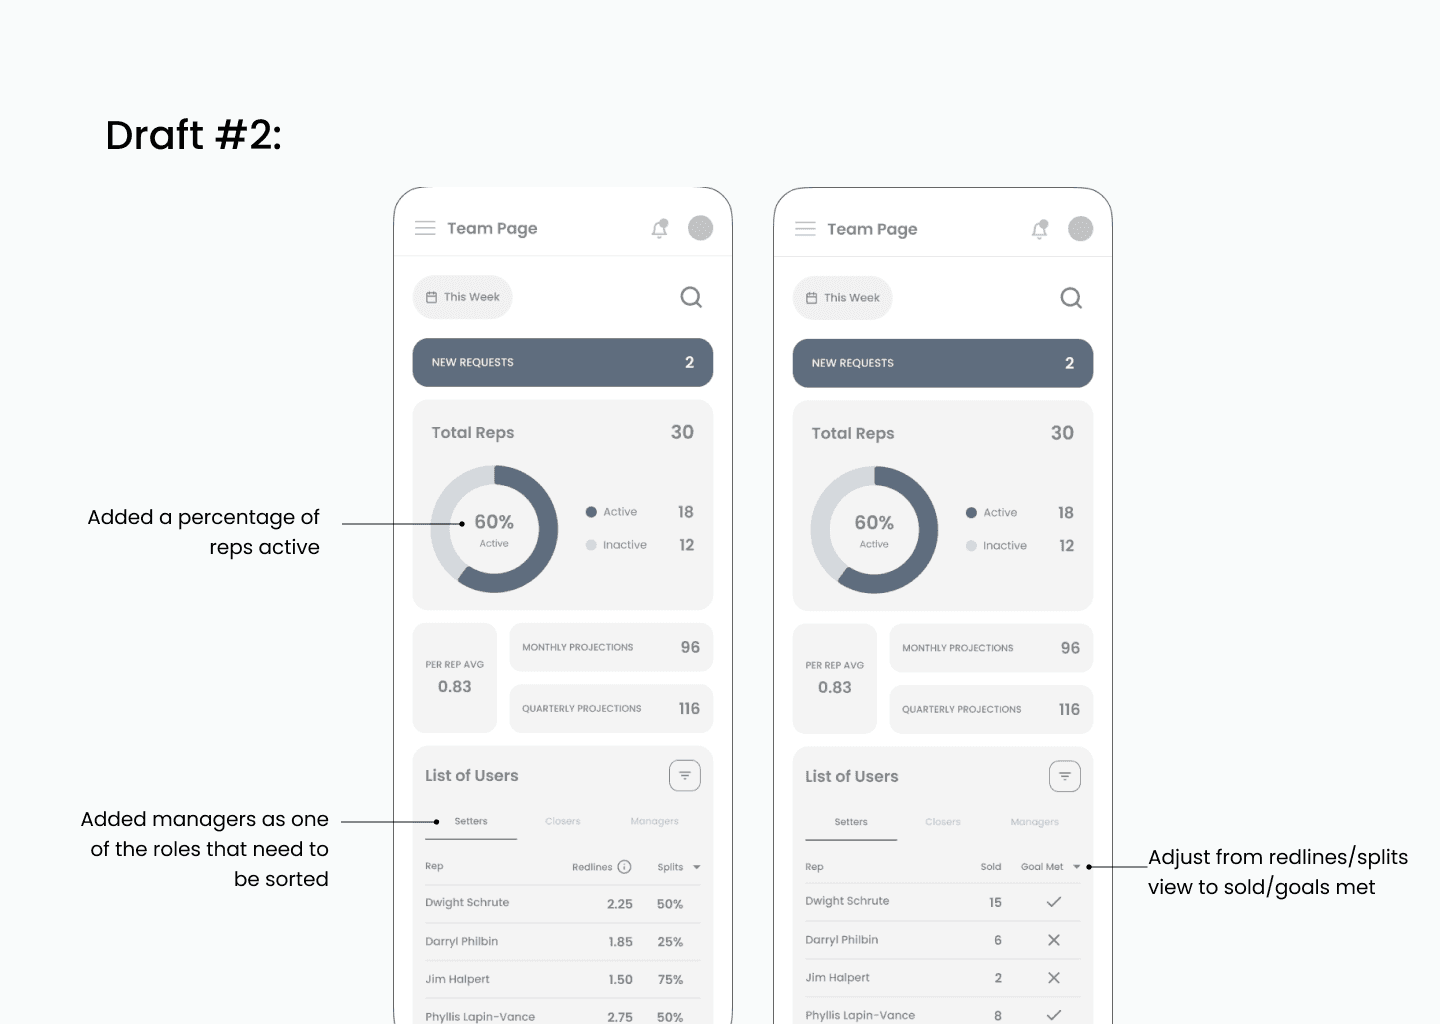
📢 Feedback received from stakeholders:
• Add a percentage indicator for active reps
• Provide at-a-glance views of redlines/splits (how much a rep earns per deal), along with deals sold and goals status
• Adjust list view by setters, closers, AND managers
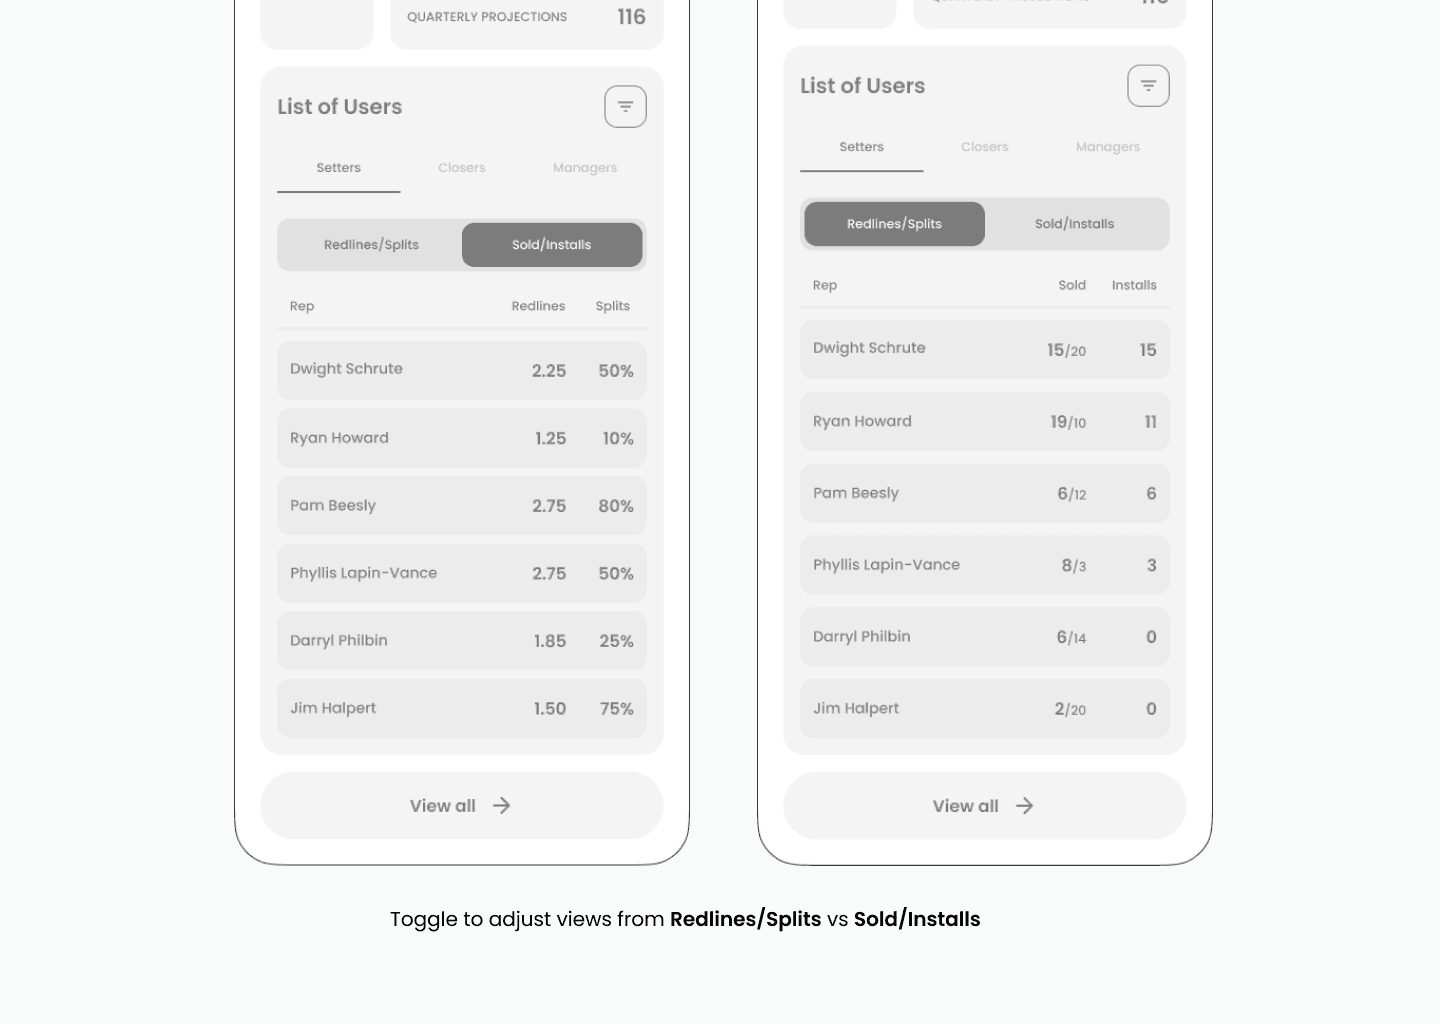
📢 Feedback received from stakeholders:
• The button to adjust the list view between redlines/splits and sold/goals met is not easily noticeable
📢 Feedback received from stakeholders:
• The button to adjust the list view between redlines/splits and sold/goals met is not easily noticeable
OTHER EXPLORATIONS
OTHER EXPLORATIONS
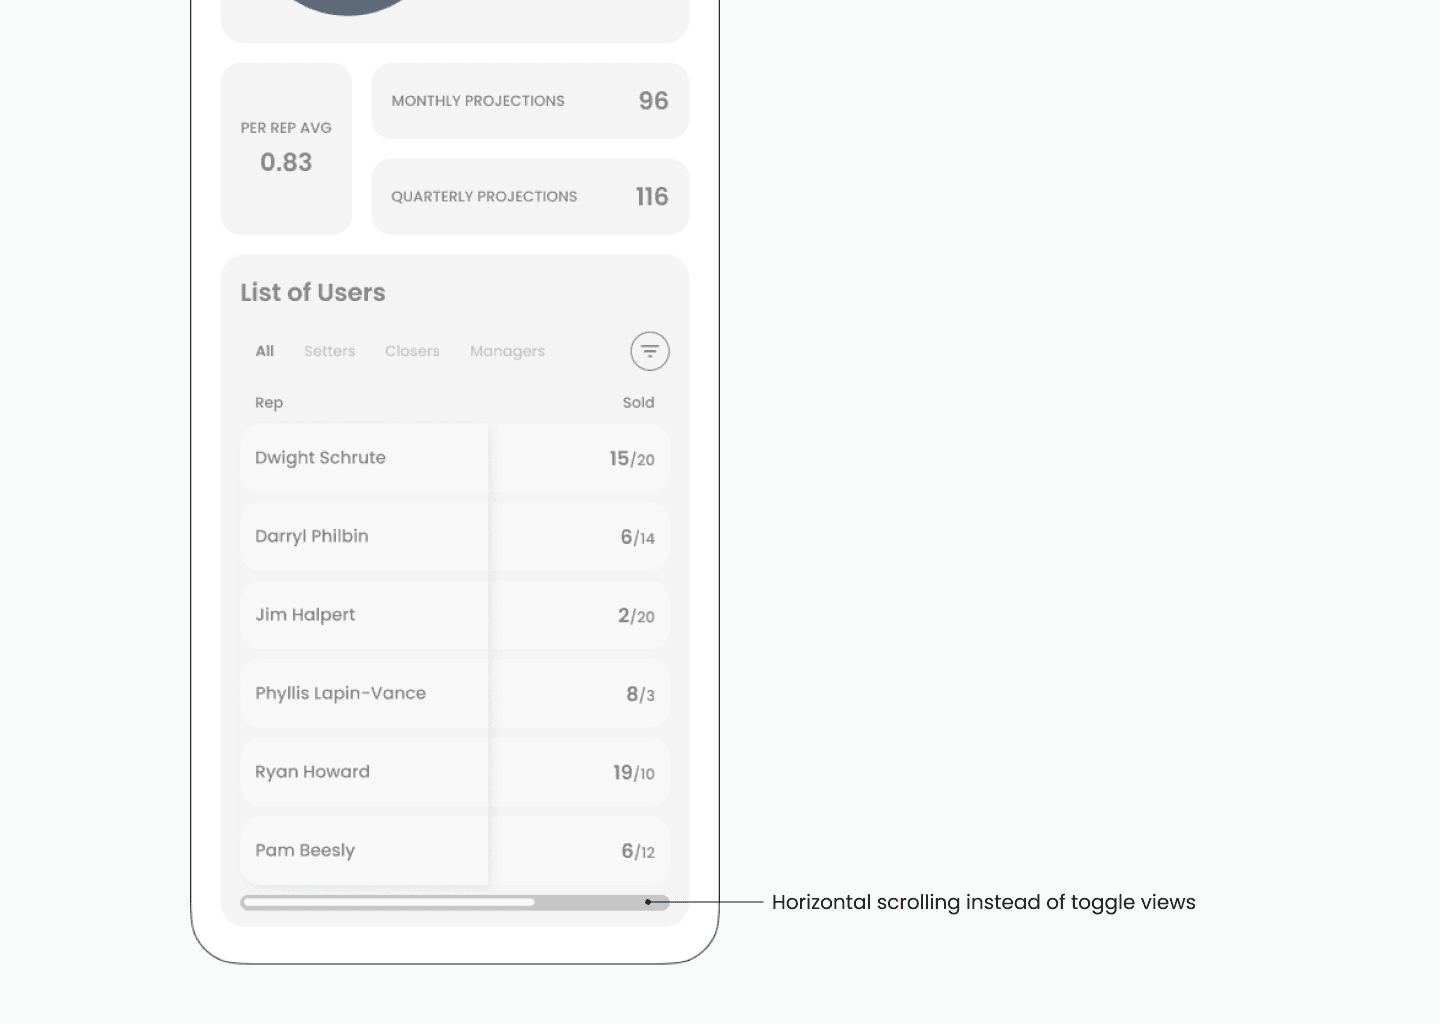
The biggest challenge I had was displaying key information at a glance without making it look too busy or overwhelming.
Below are a few design explorations I created to solve this issue. While none were the final solution, brainstorming early ideas helped me and my team explore different options, ultimately leading us to the most optimal solution.
Do I hear scope creep?* 😬
Do I hear scope creep?* 😬
Do I hear scope creep?* 😬
*Scope creep is when extra work or features are added to a project without planning for more time or resources.
*Scope creep is when extra work or features are added to a project without planning for more time or resources.
INCREASING project needs
INCREASING project needs
During the mid-fidelity stage, as the project progressed, stakeholders requested additional features beyond the original scope. I proposed launching a V1 with an MVP and making iterations post-launch instead to streamline development and provide users with a better division page sooner. However, stakeholders preferred to include all features before launch.
Requested Features:
• Ability to add reps to a team within their divisions
• View commission history for each rep
• View deactivation history, as some reps may temporarily leave and later be reactivated
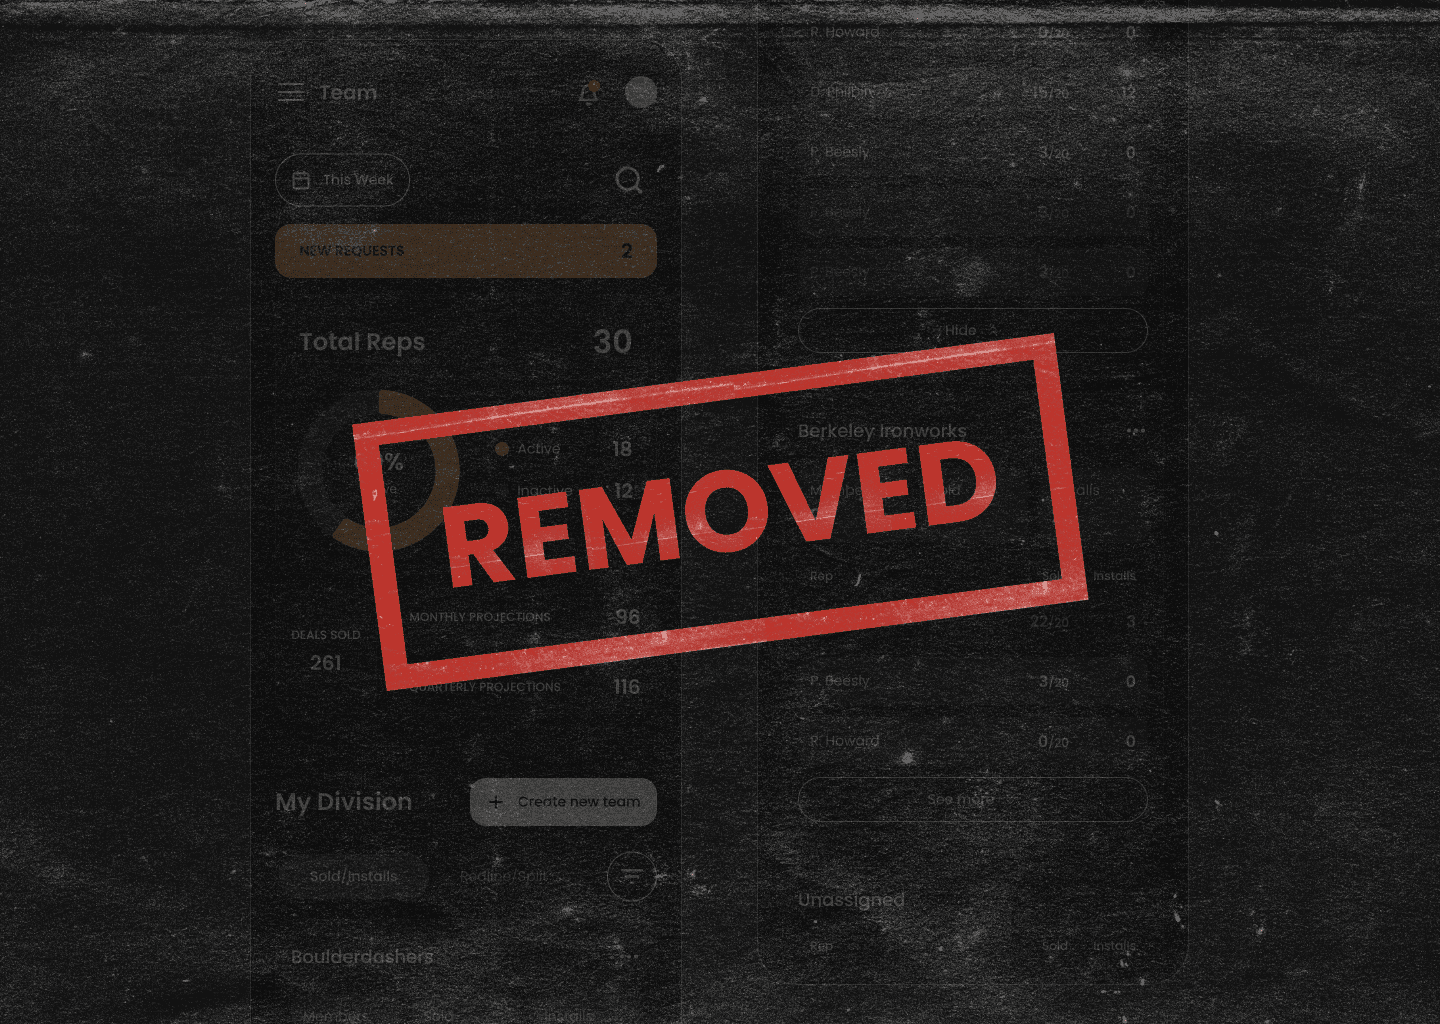
Adding reps to a team within divisions
Adding reps to a team within divisions
The screen above shows my initial approach to allowing division leaders to add reps to teams within their divisions. Some reps remain unassigned if they are not placed in a team.
I began by asking:
Why are we creating teams within divisions?
The goal was to drive competition and boost rep performance. From there, I focused on how to make team stats easy for division leaders to access and understand.
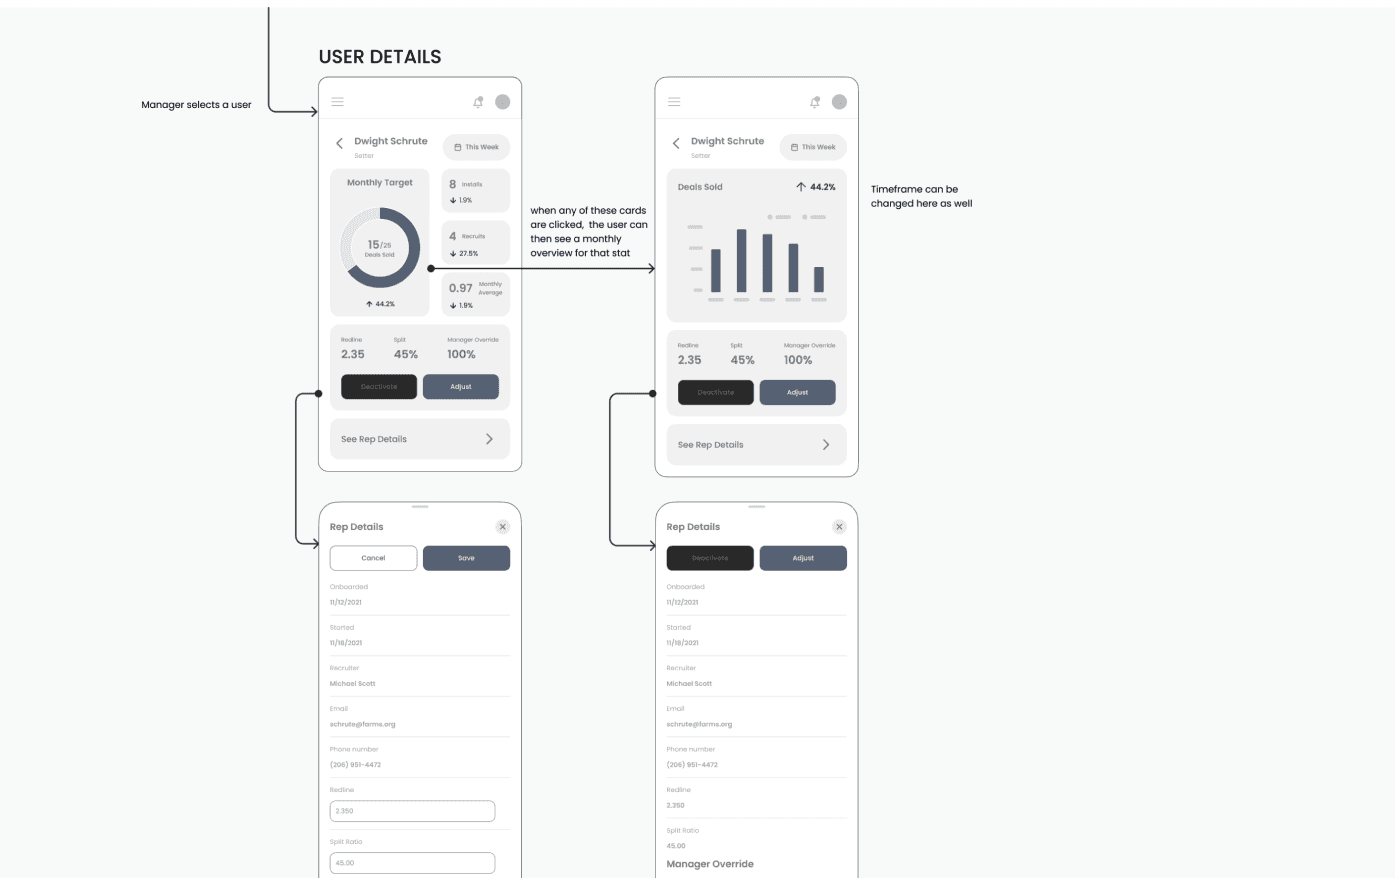
Viewing Commission History
Viewing Commission History
When viewing an individual rep’s performance page, users can access the rep's commission history. This allows leaders to review past adjustments, including when they were made and how often, before making new changes.
When viewing an individual rep’s performance page, users can access the rep's commission history. This allows leaders to review past adjustments, including when they were made and how often, before making new changes.
Viewing Deactivation History
Viewing Deactivation History
Reps may be deactivated for various reasons, such as personal circumstances or a leader deciding they are not a good fit for their team. When this happens, another leader can re-onboard the rep into a different division.
Having access to deactivation history is valuable, as it allows division leaders to see if a rep has been deactivated before and understand the reasons behind it. This context helps them make informed decisions about onboarding and team dynamics.
some really good points by dev
some really good points by dev
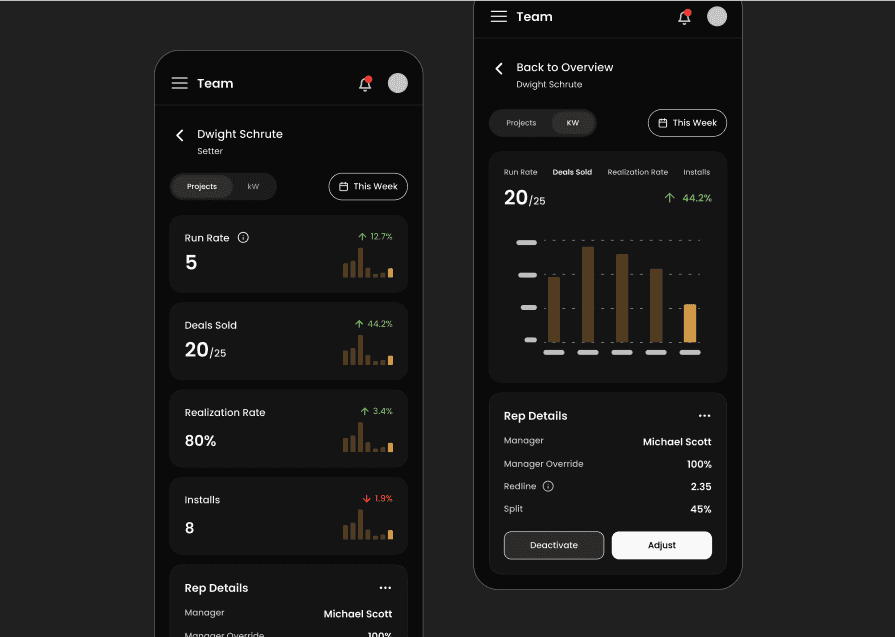
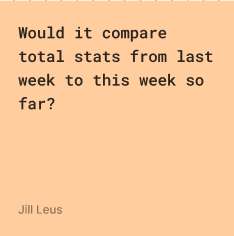
The design shown above is an individual rep’s performance page. Although the stakeholders approved the design, I also needed to review it with the lead developer. During our discussion, a few critical concerns emerged that led me to rethink my approach:
The design shown above is an individual rep’s performance page. Although the stakeholders approved the design, I also needed to review it with the lead developer. During our discussion, a few critical concerns emerged that led me to rethink my approach:
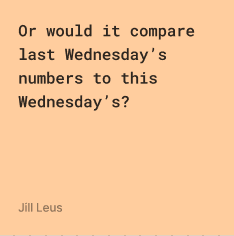
If the timeframe selected was "this week" and today was Wednesday, what exactly would the percentage change represent?
If the timeframe selected was "this week" and today was Wednesday, what exactly would the percentage change represent?
Sales reps don’t have a fixed number of deals per week or a set schedule.
Sales reps don’t have a fixed number of deals per week or a set schedule.
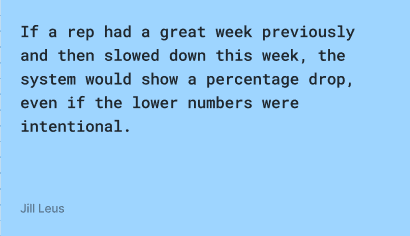
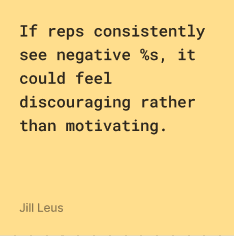
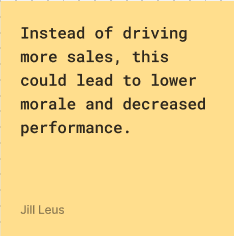
The original goal of showing % increases was to motivate reps to sell more.
The original goal of showing % increases was to motivate reps to sell more.
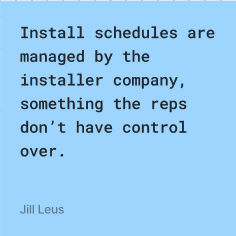
After recognizing these issues, I then reworked the design, ensuring they align with reps' real-world work patterns and business objectives.
After recognizing these issues, I then reworked the design, ensuring they align with reps' real-world work patterns and business objectives.
Finalizing the design
Finalizing the design
Finalizing the design
Remember those changes we made in the midfi stage? Yeah well.. we ended up scrapping some of it.
Remember those changes we made in the midfi stage? Yeah well.. we ended up scrapping some of it.
RIP to Teams 🪦
RIP to Teams 🪦
Given the complexity of managing multiple teams within each division, along with the need to track both team and division performances, stakeholders ultimately decided that having separate teams within divisions was unnecessary.
Given the complexity of managing multiple teams within each division, along with the need to track both team and division performances, stakeholders ultimately decided that having separate teams within divisions was unnecessary.
All-in-One Timeline + Bulk Actions 🏋🏽♀️
All-in-One Timeline + Bulk Actions 🏋🏽♀️
After conversations with stakeholders and division leaders, we combined commission and deactivation history into one view. This gave leaders a visual timeline of each rep’s journey, making it easier to track progress and key events in one place.
We also learned that leaders review performance monthly and often deactivate multiple underperforming reps at once. To support this, we added a bulk action feature, allowing them to deactivate reps and adjust commission rates more efficiently.
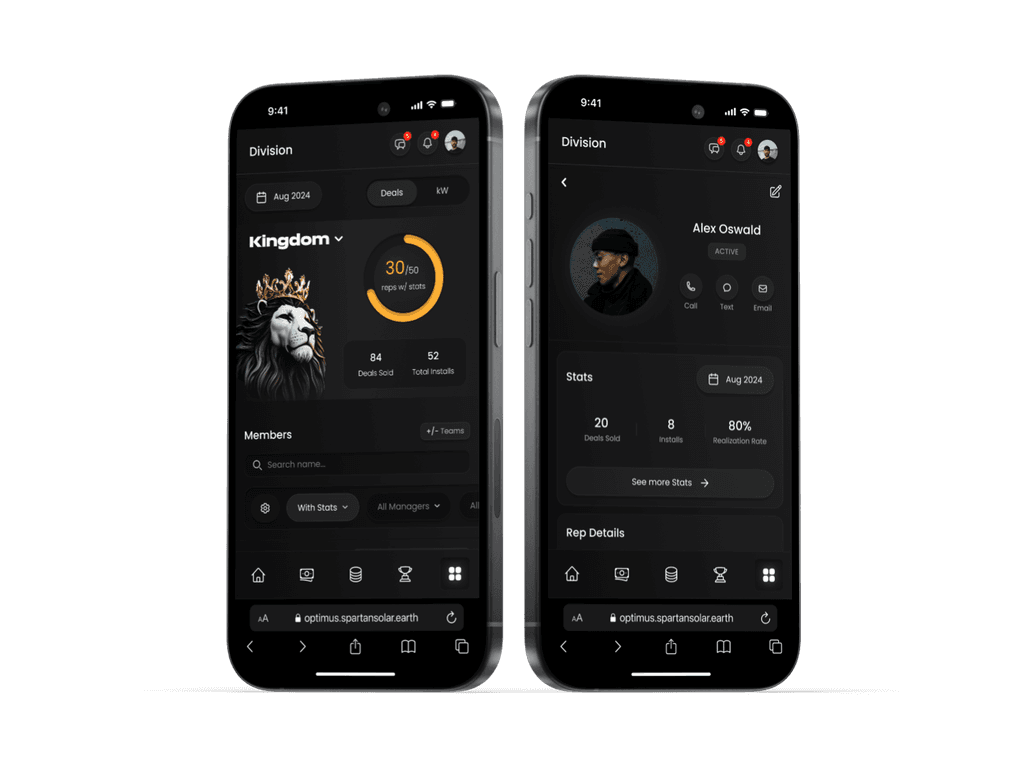
Other Changes to the Rep Overview Page ✨
Other Changes to the Rep Overview Page ✨
• Made it easier to contact reps with a quick-access option
• Moved rep detail edits to the top for better visibility and accessibility
• Merged commission and deactivation history for a full view of rep changes
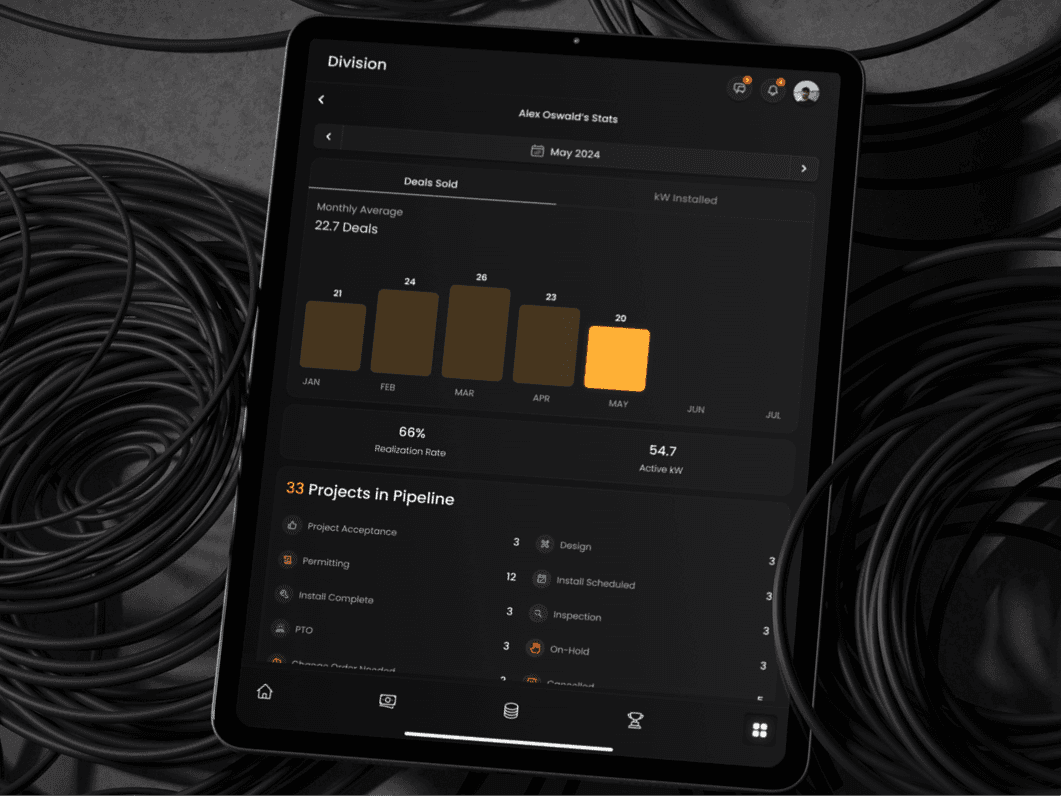
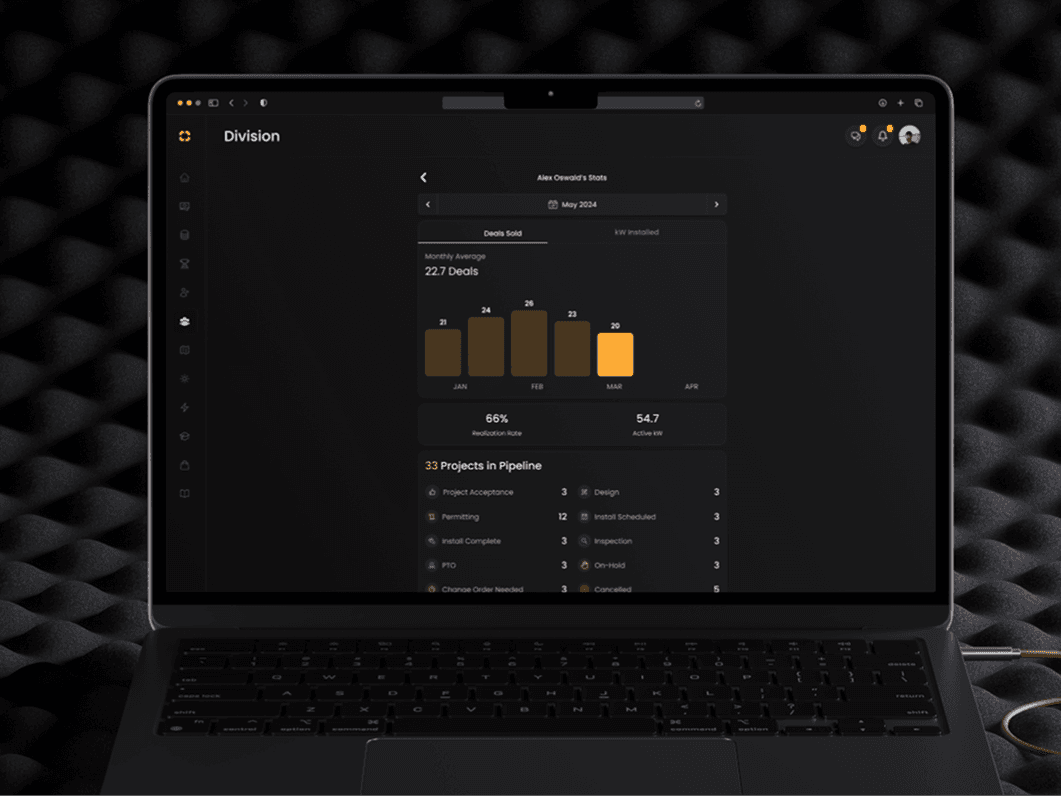
• Added a project stage breakdown to help leaders track deal progress and spot issues like stalled projects
• Made it easier to contact reps with a quick-access option
• Moved rep detail edits to the top for better visibility and accessibility
• Merged commission and deactivation history for a full view of rep changes
• Added a project stage breakdown to help leaders track deal progress and spot issues like stalled projects
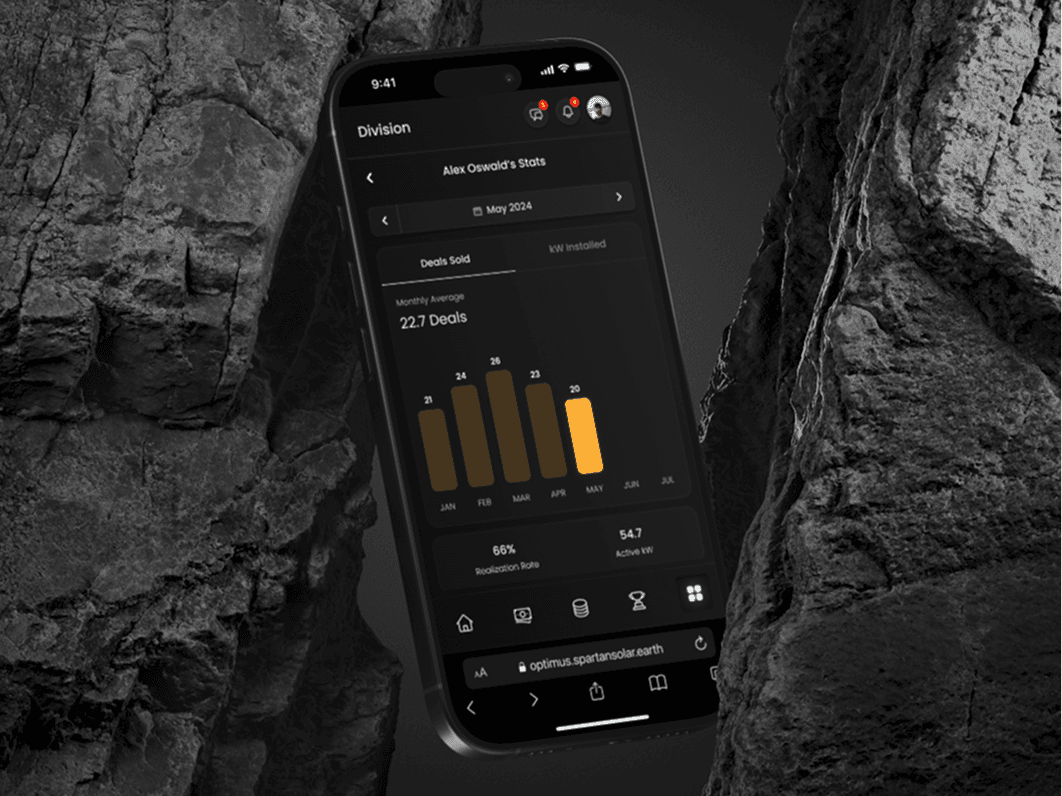
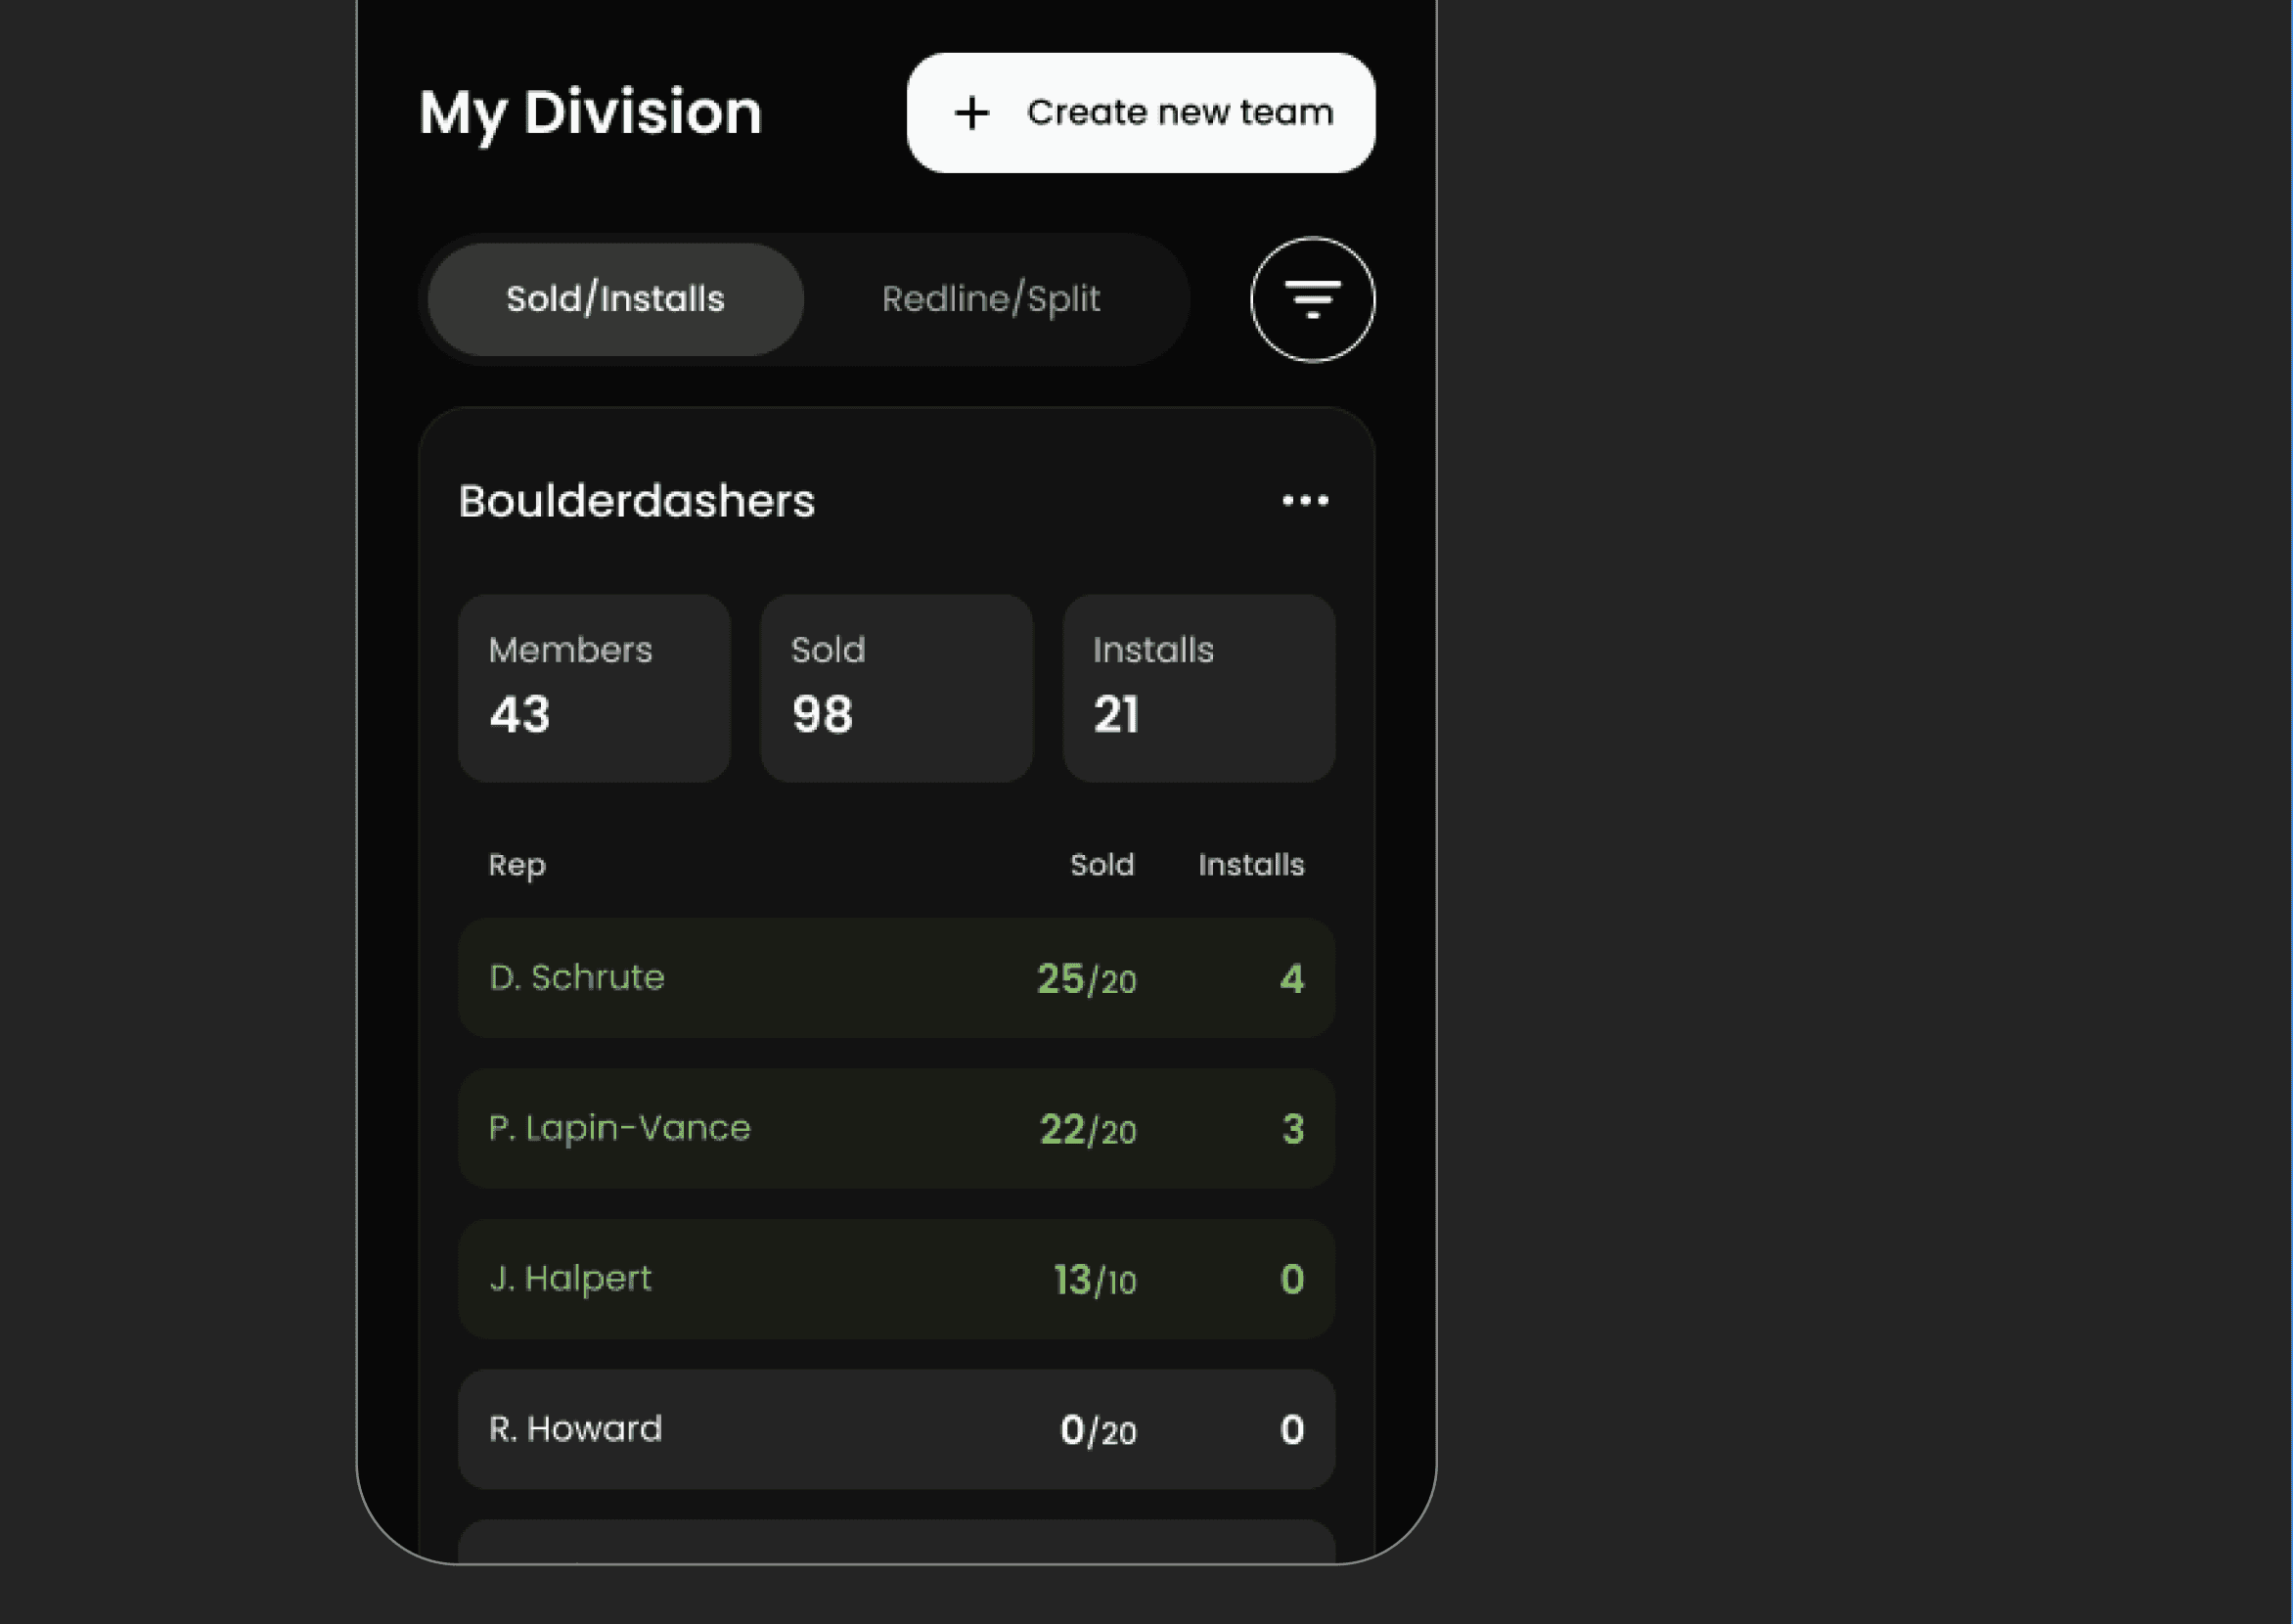
Oh and remember how I was trying to fit deals sold, installs, redlines, and splits into one view? Here's how I solved it:
Oh and remember how I was trying to fit deals sold, installs, redlines, and splits into one view? Here's how I solved it:
Oh and remember how I was trying to fit deals sold, installs, redlines, and splits into one view? Here's how I solved it:
Closing Thoughts
Closing Thoughts
Closing Thoughts
LESSONS LEARNED
LESSONS LEARNED
At the start of any project, it’s important to build a clear understanding of both the business goals and the people we’re designing for. That means spending meaningful time in the research phase: learning about users’ workflows, what motivates them, what challenges they face, and what they’re ultimately trying to achieve.
One challenge we often face in this space is access. While everyone agrees research is valuable, it’s not always easy to find time with end-users. Their days are usually packed with appointments or spent out in the field knocking doors, which can make deeper conversations difficult.
In a setting with more flexibility and resources, I would have loved to do a field study, which involves following users in their day-to-day environment to better understand their routines and needs firsthand.
NEXT STEPS
NEXT STEPS
At the time of writing, this project is still in development, so I don’t have success metrics or feedback. However, my colleague who carried the project through to completion conducted usability testing with division leaders and gathered valuable insights for iterations prior to developer handoff. The overall response was very positive! They were excited to finally have a tool designed to support and streamline their workflow, something they’d been needing for a long time.
As we move toward launch, we’re eager to gather real-world feedback, continue iterating, and ensure this page delivers lasting impact. This project is just the beginning of a more data-informed, empowered approach to leadership across divisions.